

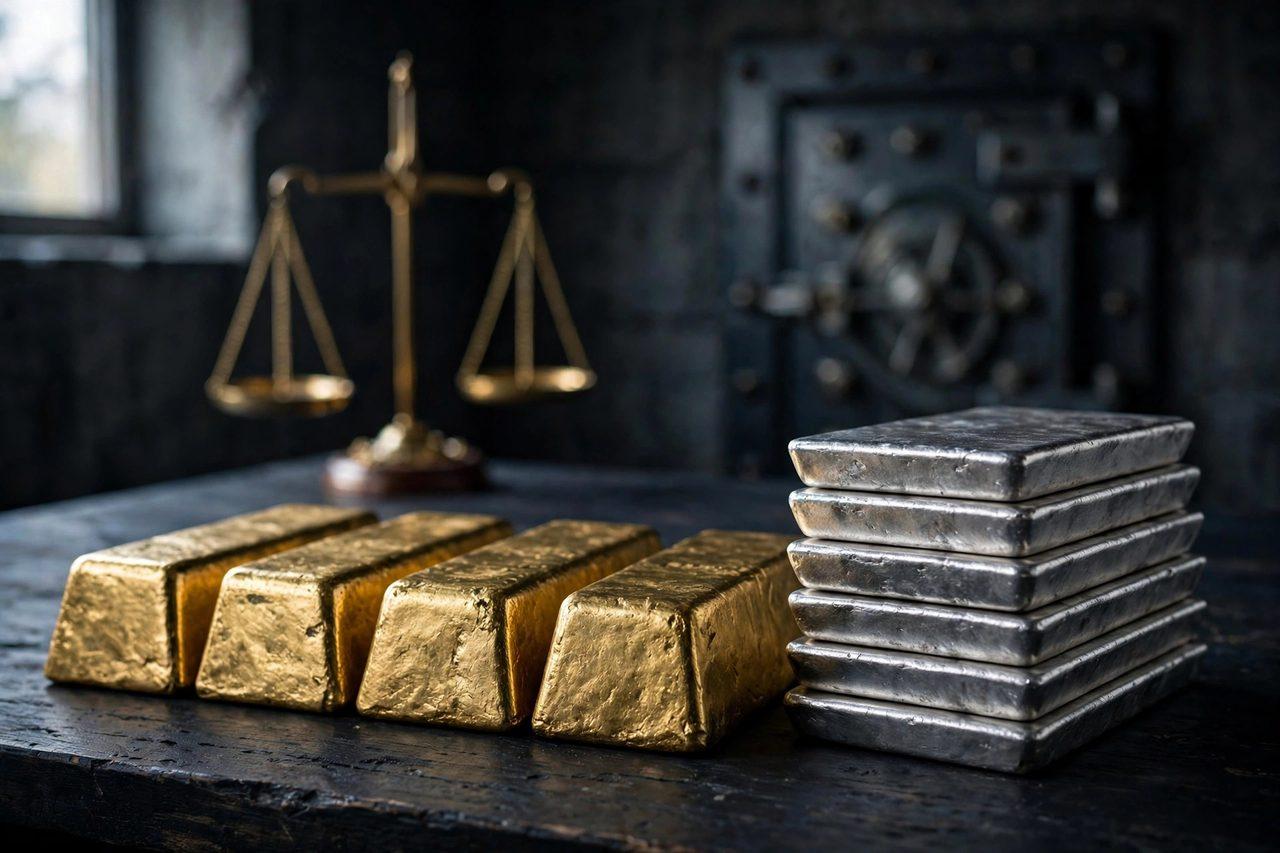
What Is the Gold-Silver Ratio? How Traders Use It to Compare the Two Metals, Explained

The gold-silver ratio is the oldest shortcut in precious metals: divide the gold price by the silver price and you get how many ounces of silver one ounce of gold buys. On November 9 the maths was simple — spot gold closed near $4,140.40 an ounce and silver near $53.32, giving a ratio of about 78 — near the top of its modern range, which is exactly when this guide matters most.
Neither metal has to move for the ratio to be useful. It answers a different question from "will gold rise?" — it asks which of the two metals is relatively cheap against the other, a discussion that runs daily on the Zimbuck News page.

How to Calculate It
- Formula: gold price per ounce ÷ silver price per ounce, same currency, same moment
- November 9 example: $4,140.40 ÷ $53.32 = about 77.6, quoted as ~78
- Reading: one ounce of gold buys roughly 78 ounces of silver
- Use spot or benchmark prices — jewellery prices include making charges and distort the comparison
A Short History of the Ratio
Governments once fixed this ratio by law. The U.S. Coinage Act of 1792 set it at 15 to 1. Since gold began floating freely in 1971, the ratio has averaged roughly 65 to 1, mostly travelling in a broad 40–90 band. Its extremes mark stressed markets: it spiked to about 125 in March 2020 when investors dumped everything except the safest metal, and it compressed toward the low 30s in 2011 when silver speculation peaked. Knowing that history stops a common error — treating any single reading as "high" or "low" without context. Metals watchers compare notes on readings like these in the Zimbuck Market News group.

How Traders Actually Use It
The classic use is relative-value tilting. When the ratio runs high — many use above 80 as the marker — silver looks historically cheap against gold, so buyers directing fresh savings into metals lean toward silver. When it falls toward 50 or below, gold looks relatively cheap and the tilt reverses. Some long-term holders go further with a swap strategy: exchange gold for silver at a high ratio, then swap back at a lower one, growing their total ounces without adding new money — the March-to-August 2020 swing from ~125 to ~68 is the textbook example.
Why does the ratio move at all if both metals share drivers like the dollar and real yields? Because silver is only half a monetary metal. Roughly half of silver demand is industrial — solar panels, electronics, electric vehicles — so silver tends to outperform in growth-driven rallies and underperform in panics, while gold, the pure safe haven, holds up when fear dominates. That split is also why silver is the more violent ride: the same position size swings far harder. The two metals' behaviour on days like November 9 — gold up 1.70%, silver up 2.60% as oil fell and the dollar weakened, per Kitco's November 9 market report — is the ratio narrowing in real time.
The Limits — Read This Before Using It
The ratio is a thermometer, not a forecast. It can sit above 80 for years without silver rallying, and extremes can stretch further before they turn — 2020's 125 proved that. It also says nothing about direction: both metals can fall together while the ratio improves for silver. Used as one input among several — alongside the benchmarks explained in the WTI vs Brent guide and the price action covered in gold topping $4,100 as oil slid — it is a useful discipline. Used alone as a timing trigger, it disappoints.
FAQ
What is a "normal" gold-silver ratio? Since 1971 it has averaged about 65, mostly ranging between 40 and 90. November 9's ~78 sits toward the higher, silver-cheaper end.
Does a high ratio mean silver will rise? No. It means silver is cheap relative to gold historically. Relative cheapness can persist or deepen; it is context, not a promise.
Which prices should I use? Spot or benchmark prices for both metals, in the same currency and unit, at the same time — never retail jewellery prices.
This article is general educational information only, not financial advice. Join the conversation on Zimbuck — the finance social platform for traders and investors.






