


What Is Fibonacci Retracement in Trading? How to Draw the 38.2%, 50% and 61.8% Levels — Explained

What Is Fibonacci Retracement in Trading? How to Draw the 38.2%, 50% and 61.8% Levels — Explained
Fibonacci retracement turns one completed price swing into a map of where the next pullback might stop. Traders draw five horizontal levels — 23.6%, 38.2%, 50%, 61.8% and 78.6% — between a swing low and a swing high, then watch for the trend to resume from one of them instead of guessing where a falling price will land.
The tool works best in a trending market, which makes it directly relevant today: Bitcoin is holding near $73,000–$73,700 and Ethereum near $2,030–$2,050 after a multi-week slide, and every bounce raises the same question — how deep is this retracement, and where would it become a reversal? Follow the live discussion on the Zimbuck News page and in the Zimbuck Market News group.

Where the levels come from
The ratios come from the Fibonacci sequence — 0, 1, 1, 2, 3, 5, 8, 13, 21 — where each number is the sum of the two before it. Divide a number by the next one and the result approaches 0.618; divide by the previous one and it approaches 1.618, the golden ratio. The retracement levels are powers and relatives of that ratio: 23.6%, 38.2% and 61.8% are true Fibonacci ratios, while 78.6% is the square root of 0.618. The famous 50% level is not a Fibonacci ratio at all — it is simply the halfway point of the swing, included because traders have watched it for a century.
A practical step-by-step for drawing and reading the tool, including worked examples, is covered in this Fibonacci retracement guide.
How to draw Fibonacci retracement, step by step
- Confirm a trend first. Higher highs and higher lows (uptrend) or lower highs and lower lows (downtrend). In a sideways market the levels mean very little.
- Pick one clear swing. Use the most recent significant move that stands out on your timeframe — an obvious swing low and swing high, not a small wiggle inside the move.
- Drag in the direction of the trend. Uptrend: from the swing low up to the swing high. Downtrend: from the swing high down to the swing low.
- Use the wicks. Anchor on the actual high and low prices, so your levels match what most other traders are watching.
- Read the levels back from the end of the move. 0% sits at the end of the swing and 100% at its start. A pullback past 100% has erased the whole move.
- Redraw on a new swing. When price makes a fresh high or low and pulls back again, the old map is finished.
What each level usually tells you
- 23.6% — shallow: a brief pause in a strong trend; momentum traders watch it first.
- 38.2% — moderate: the most common first serious test in a healthy trend.
- 50% — halfway: the classic decision point; holding it keeps the swing's story intact.
- 61.8% — deep, the "golden ratio" level: the most-watched line of all. The narrow band between 61.8% and 65% is often called the golden pocket.
- 78.6% — very deep: the last major level before the move is effectively erased; a clean break beyond it usually invalidates the pullback idea.
A worked illustration: on a rise from $70,000 to $80,000 (a $10,000 swing), the levels sit at $77,640 (23.6%), $76,180 (38.2%), $75,000 (50%), $73,820 (61.8%) and $72,140 (78.6%). The arithmetic is always the same — level = swing high minus the ratio times the swing height — which is why two traders using the same swing get the same map, and why the levels work partly as a shared reference: many orders cluster where many eyes are looking.
Using the levels with confirmation, not blind orders
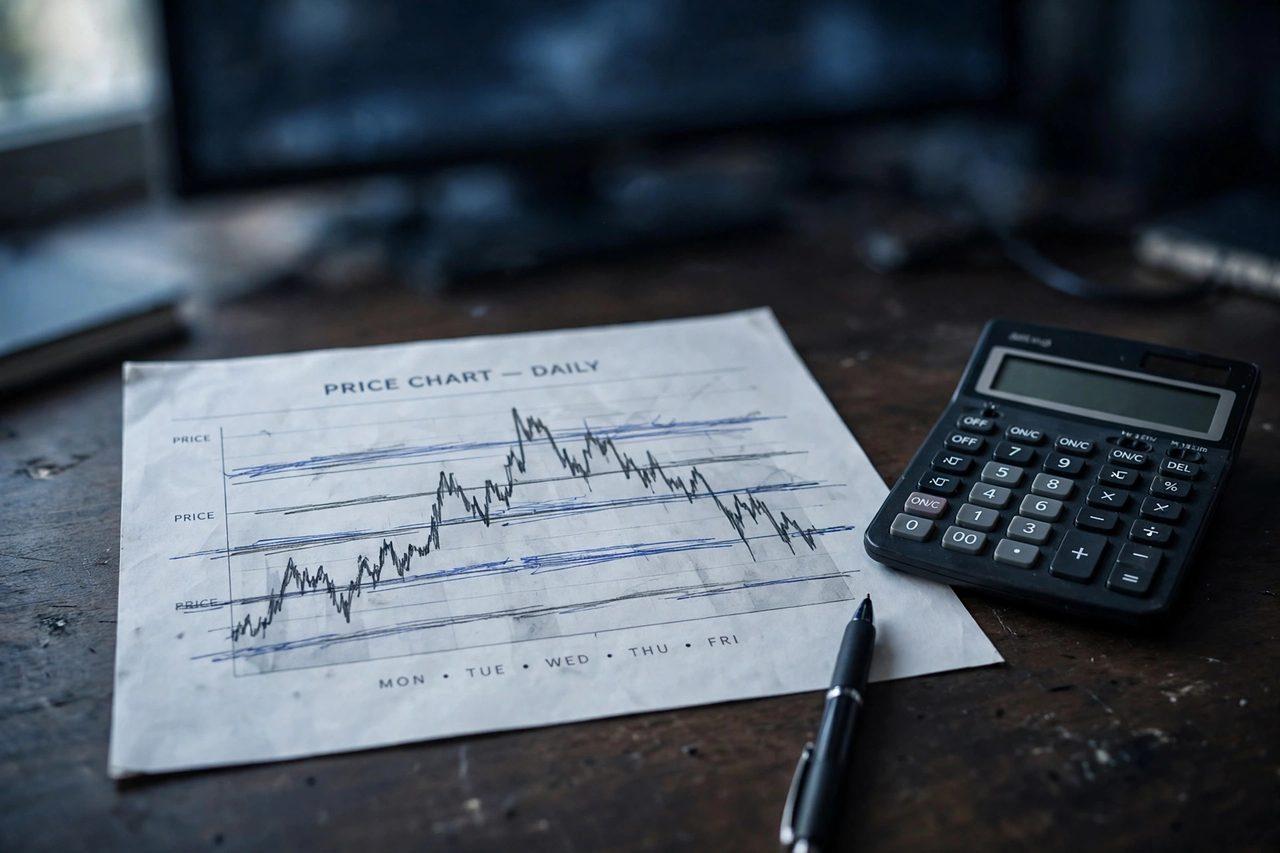
Experienced traders treat the 38.2%–61.8% band as a decision zone, not an automatic buy. They look for confluence — a Fibonacci level that lines up with earlier support or resistance, a round number, or a key level from another method such as the pivot points in our earlier guide — and then wait for a price reaction: a rejection candle with a long wick at the level, or a close back above it. Stops usually sit beyond the next level down or beyond the swing itself, not directly on the line, and targets can be planned with Fibonacci extension levels at 127.2% and 161.8% of the swing. Combining tools this way is the same discipline behind our Ichimoku Cloud guide: one indicator proposes, structure and price action dispose.
Frequently asked questions
Does Fibonacci retracement actually work? The levels are not magic and predict nothing by themselves. They work as a consistent framework: they define pullback depth objectively, they are watched by enough traders to attract real orders, and they give you pre-planned invalidation points.
Which timeframe is best? The timeframe you trade, checked against a higher one. A level that is obvious on both the 4-hour and the daily chart carries more weight than one visible on a single noisy chart.
What is the difference between retracement and extension? Retracement levels sit inside the completed swing (0–100%) and map pullbacks. Extension levels sit beyond it (127.2%, 161.8%) and map where a continued trend might travel — mainly used for profit targets.
What invalidates a Fibonacci setup? A pullback that closes decisively beyond 78.6%, and especially beyond 100% of the swing, means the "pullback" is behaving like a reversal. Redraw on the new swing or stand aside.
Fibonacci retracement will not tell you the future — but it replaces the most emotional question in trading, "how far will this fall?", with a measured map, clear zones and a line where you admit you were wrong. Practise drawing it on the current Bitcoin and Ethereum charts and compare notes with other traders on Zimbuck.
This article is market news and general information only, not financial advice. Always do your own research before trading.






