


What Is GDP? How Growth, Revisions and Per-Capita Figures Actually Move Markets — a Beginner's Guide

Gross domestic product — GDP — is the single most quoted number in economics, and one of the least understood. It appears in every market headline, moves stocks, bonds and crypto on release day, and is routinely misread as a score for how well ordinary people are doing. It is none of those things, exactly. GDP is a measure of production: the value of the goods and services an economy produces, minus what was used up making them. Understanding what goes into it, how it is revised, and what it leaves out is the difference between reacting to a GDP headline and actually reading one.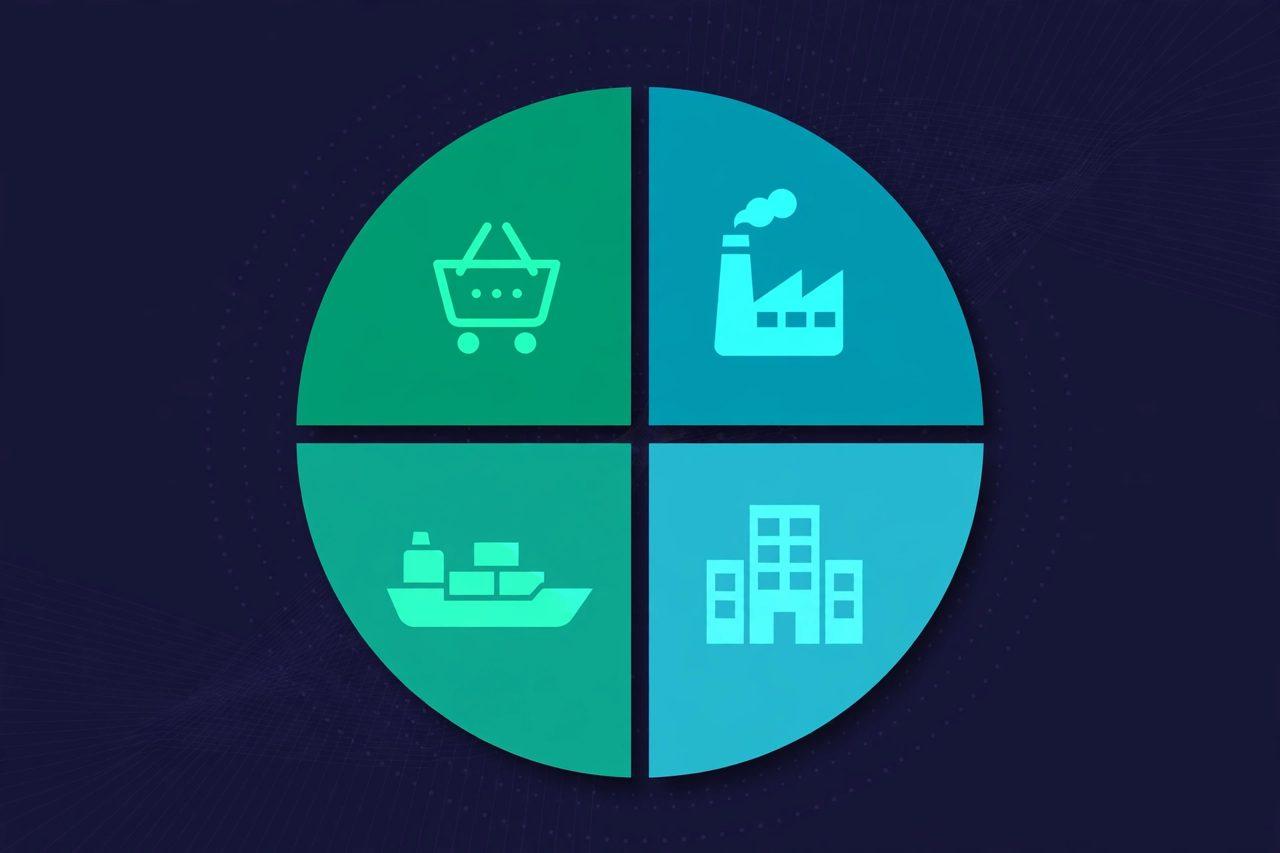
The four components. The US Bureau of Economic Analysis (BEA) defines GDP as the sum of four spending parts: personal consumption expenditures (what households spend), gross private domestic investment (what businesses and households invest, including housing and equipment), government consumption expenditures and gross investment (what governments spend and invest), and net exports (exports minus imports). In shorthand: GDP = C + I + G + (X − M). Consumption is usually the largest part by far, which is why consumer spending data moves GDP forecasts more than almost anything else. Investment is the most volatile part — it swings with business confidence, interest rates and inventories. Government spending can lift a quarter sharply, as it did in the third quarter of 2026 (see below). And net exports are the part most often misread: a rise in imports subtracts from GDP arithmetically, because imports were never domestic production in the first place — they are subtracted to avoid counting foreign-made goods as domestic output, not because buying imports "hurts" GDP in the moral sense.
Nominal vs real, and the annualised rate. Two adjustments confuse almost every first-time reader. First, nominal GDP counts current prices, while real GDP strips out inflation, so real growth measures more stuff produced, not just higher prices. When headlines say "GDP grew 3.4%", they almost always mean real GDP. Second, US quarterly GDP is reported at an annualised rate: the quarter's growth is expressed as if it continued for a full year. A 3.4% annualised rate does not mean the economy grew 3.4% in three months — it means it grew at a pace that would equal 3.4% over a year. That is why quarter-on-quarter and year-on-year figures look so different for the same quarter, and why comparing a quarterly annualised print with an annual growth rate is a category error.
The worked example: Q3 2026. The BEA's advance estimate for the third quarter of 2026, released October 29, 2026, put real GDP growth at 3.4% annualised, beating the 3.2% consensus and up from 2.2% in the second quarter — but year-on-year growth actually eased to 2.07% from 2.19%, a reminder that the two lenses tell different stories. Inside the number: personal consumption grew 3.8%, investment added 3.27 percentage points (led by inventories and equipment spending, with computers and peripheral equipment alone adding 0.72 point, the largest contribution on record in data back to 1959), government added 0.90 point on federal spending, and net exports dragged by 3.32 points as imports jumped 19.67% while exports fell 5.74%. The GDP price index — the inflation measure inside the release — came in at 2.3%, down sharply from 6.1% in the second quarter. Read together, that is a strong headline with a mixed interior: domestic demand strong, trade a large drag, inflation cooling inside the same report. A reader who stopped at "3.4% beat" missed all of tha
Revisions: the first number is a draft. The BEA releases three vintages of each quarterly estimate. The advance estimate comes near the end of the first month after the quarter ends, based on incomplete source data. The second estimate follows near the end of the second month, and the third near the end of the third month, each built on more detailed and comprehensive data. For Q3 2026, the second estimate was scheduled for November 25 and the third for December 23. Across 1999–2022, the mean absolute revision from advance to third estimate was 0.58 percentage points, and from advance to the latest available figure 1.21 points — large enough to change the story of a quarter, small enough that the direction usually survives. The practical rule: treat an advance print as a strong signal, not a final verdict, and always check what the revision changed — a revision driven by consumption means something different from one driven by inventories, which often reverses on their own.
Per capita, and what GDP leaves out. Divide GDP by population and you get GDP per capita — a rough proxy for average output per person, not average income, and certainly not average wellbeing. GDP counts production whether it is useful or harmful, counts government spending at cost rather than value, misses unpaid work (care, housework, volunteering) entirely, misses much of the informal economy, and says nothing about distribution: a country can grow while most people's incomes stagnate, if the gains concentrate at the top. It also says nothing about sustainability: depleting a resource counts as production today and leaves no entry for what is gone tomorrow. None of that makes GDP useless — it makes it a production measure, to be read alongside jobs, wages, inflation and household income, not instead of them.
How to read a GDP release in five checks. First, headline vs consensus: did growth beat, miss or match what forecasters expected — the surprise, not the level, moves markets. Second, the revision to the previous quarter: was last quarter's story rewritten? Third, the components: which parts drove growth, and which dragged — consumption-led growth is steadier than inventory-led growth. Fourth, the price index inside the release: is inflation inside GDP rising or cooling, and what does that imply for interest rates? Fifth, final sales to private domestic purchasers — GDP minus inventories, net exports and government — often considered a cleaner read on underlying private demand; in Q3 2026 it rose 4.9%, the most since Q2 2021, even as headline real final sales were only 1.7%. Run those five checks, and a GDP release stops being a single scary number and becomes a map of where an economy is actually moving.
Why markets react — and why they sometimes don't. Stronger-than-expected GDP can lift stocks (better earnings outlook) and hurt bonds and crypto at the same time (stronger growth means fewer expected interest-rate cuts, higher yields, tighter financial conditions). Weaker GDP can do the reverse. But the reaction depends on what else is in the release: a strong headline with cooling inflation is friendlier to rate cuts than a strong headline with hot inflation, and a headline driven by inventories will be discounted by traders who know inventories reverse. That is why the same "3.4%" can be greeted as good news in one quarter and shrugged off in another — the market is reading the interior, not the cover.
FAQ
What is GDP, in one sentence? The value of the goods and services an economy produces, less what was used up in production — the sum of consumption, investment, government spending and net exports.
What is the difference between nominal and real GDP? Nominal counts current prices; real strips out inflation, so real growth measures more output, not just higher prices.
Why is US quarterly GDP "annualised"? The quarter's pace is expressed as a yearly rate — 3.4% annualised does not mean 3.4% growth in one quarter.
Why is GDP revised three times? The advance estimate uses incomplete data; the second and third estimates use more detailed data. The average advance-to-third revision was 0.58 percentage points (1999–2022).
What was US Q3 2026 GDP? The advance estimate was 3.4% annualised, above the 3.2% consensus and up from 2.2% in Q2, with consumption up 3.8% and the GDP price index at 2.3%; the second estimate is due November 25.
Does GDP measure how well people live? No — it measures production, not distribution, wellbeing, unpaid work or sustainability. Read it alongside jobs, wages and inflation.
Read more on Zimbuck: how to read a CPI inflation report is here, https://zimbuck.com/blogs/792/How-to-Read-a-CPI-Inflation-Report-Headline-vs-Core , and how interest rates move stocks, bonds and crypto is here, https://zimbuck.com/blogs/868/How-Interest-Rates-Move-Stocks-Bonds-and-Crypto — plus the Zimbuck News page at https://zimbuck.com/pages/zimbucknews and discussion at https://zimbuck.com/groups/zimbuckmarketnews . The BEA's GDP release information this guide is based on is here: https://bea.gov/news/gdp-release-additional-information . This is general information and education only, not financial advice. Join Zimbuck at https://zimbuck.com to follow more economic coverage.




