

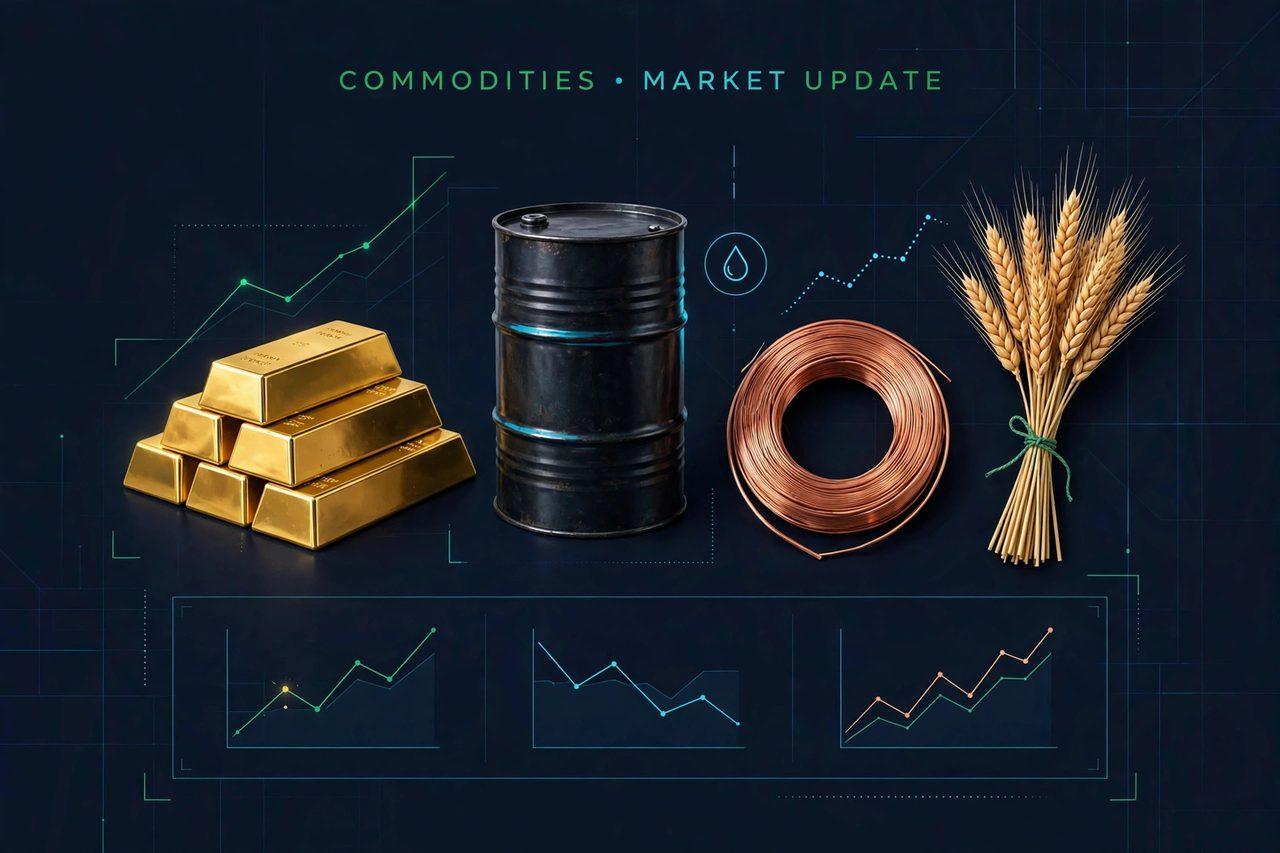
How to Read a Commodity Board: Gold, Oil, Copper and Crops Without Getting Lost in the Numbers

On November 4, 2026, a single commodity board told five different stories at once. Spot gold edged up 0.2% to $3,934.75 an ounce while US gold futures for December delivery rose 0.1% to $3,943.20. Brent crude fell 0.25% to $103.34 a barrel and US WTI fell 0.55% to $95.56, after oil had already dropped about 1% the day before to its lowest in nearly four weeks. Copper fell 2.1% to around $14,036 a tonne, tin dropped 4.3% to around $47,435 a tonne, December corn fell to $4.4225 a bushel — its lowest since July 2 — and soybeans slipped to $12.1275, their lowest since August 17. If that paragraph felt like noise, that is because a commodity board is not one market. It is four markets — energy, metals, agriculture and softs — each quoted in different units, driven by different forces, and reported in two prices at once: spot and futures. This guide teaches you to read it.

Start with the two prices that appear for almost every commodity. The spot price is what the physical commodity trades for right now — gold at $3,934.75 an ounce, for example. The futures price is what traders agree today for delivery later — December gold at $3,943.20, slightly above spot. When futures trade above spot, the market is in contango, which is normal for commodities that cost money to store: the future price includes storage, insurance and financing. When futures trade below spot, the market is in backwardation, which usually signals tight immediate supply — buyers will pay more for the commodity now than for delivery later. That single relationship tells you more than the day's percentage move: on November 4, gold's small contango said storage and financing, not a shortage; oil's slide, by contrast, was a story about peace-talk hopes for Ukraine and Iran easing supply fears, even as attacks in both conflicts kept disruption risk alive.
Units, drivers and the traps
The second skill is units — because commodities refuse to share one. Gold and silver are priced per troy ounce (31.1035 grams), not the regular ounce on your kitchen scale. Oil is priced per barrel (42 gallons), and Brent (the global benchmark, from the North Sea) almost always trades above WTI (the US benchmark) because of transport and quality differences — on November 4 that gap was about $7.78 ($103.34 versus $95.56). Copper and other base metals are priced per tonne on the London Metal Exchange, grains per bushel, sugar per pound. A beginner's most common mistake is comparing a "big" move in one unit with a "small" move in another: tin's 4.3% fall and copper's 2.1% fall on November 3 were both large moves in industrial metals, driven by worries about technology investment and demand, while gold's 0.2% rise was a small move in a market being pulled two ways — softer oil easing inflation worries (good for gold) against a 78% market-implied chance, per CME FedWatch, of a Federal Reserve rate rise in December (bad for gold, which pays no yield).
The third skill is knowing what actually moves each group. Energy moves on supply news and geopolitics: on November 4, traders weighed US–Iran peace talks against the fact that oil throughput through the Strait of Hormuz was still only about 56% of pre-conflict levels. Precious metals move on real interest rates, the dollar and fear: the dollar index sat near 101.57–101.70, and gold's overnight bounce to about $3,965.80 on safe-haven demand faded as quickly as it came. Industrial metals move on growth and construction demand — copper at its lowest since August 19 is a growth warning, not a metals story alone. Agriculture moves on weather, harvests and trade flows: corn at four-month lows and soybeans at their lowest since August 17 reflected US harvest pressure, while wheat fell on hopes of improved Black Sea grain flows from Russia–Ukraine peace talks. When you read a board, ask which driver is in charge today — and check whether the move is broad (all base metals falling together, as on November 3) or specific (one crop, one metal). Broad moves are macro; single-commodity moves are usually supply stories. Follow commodities coverage on the Zimbuck News page and in the Zimbuck Market News group. Join the conversation on Zimbuck to discuss which commodity board you watch first — gold, oil, or copper — and what it is telling you this week.
FAQ
What is the difference between spot and futures prices? Spot is the price for immediate delivery; futures is the price agreed today for delivery later. Gold on Nov 4: spot $3,934.75/oz, December futures $3,943.20/oz.
What is contango? When futures trade above spot, usually because storage, insurance and financing cost money. Gold's small premium on Nov 4 was a normal contango.
What is backwardation? When futures trade below spot, usually signalling tight immediate supply — buyers pay more now than for later delivery.
Why is Brent more expensive than WTI? Brent is the global benchmark and WTI the US benchmark; transport costs and crude quality create a gap — about $7.78 on Nov 4 ($103.34 vs $95.56).
Why did copper and tin fall while gold rose on Nov 4? Different drivers: industrial metals fell on growth/tech-investment worries (copper -2.1%, tin -4.3%), while gold edged up as softer oil eased inflation concerns, even with a 78% chance priced for a December Fed rate rise.
What units are commodities quoted in? Gold/silver per troy ounce, oil per barrel, base metals per tonne, grains per bushel, sugar per pound — never compare raw price levels across units.
This article is market news and general information only, not financial advice.




