



Ask an analyst whether a stock is cheap or expensive and the first number they reach for is almost always the same: the price-to-earnings ratio, or P/E. It is the single most used valuation tool in stock markets, it takes ten seconds to calculate, and it is misunderstood almost as often as it is used. The formula is simple: P/E = share price ÷ earnings per share (EPS). If a stock trades at $100 and earns $5 per share over the last year, its P/E is 20 — investors are paying 20 times the company's annual earnings to own it. Read another way, the ratio has units of years: at current earnings, it would take 20 years of those earnings to add up to the price you paid. That "years to pay back" reading is the intuition that makes the ratio useful — and also the first trap, because it assumes earnings stay flat forever, which they never do.
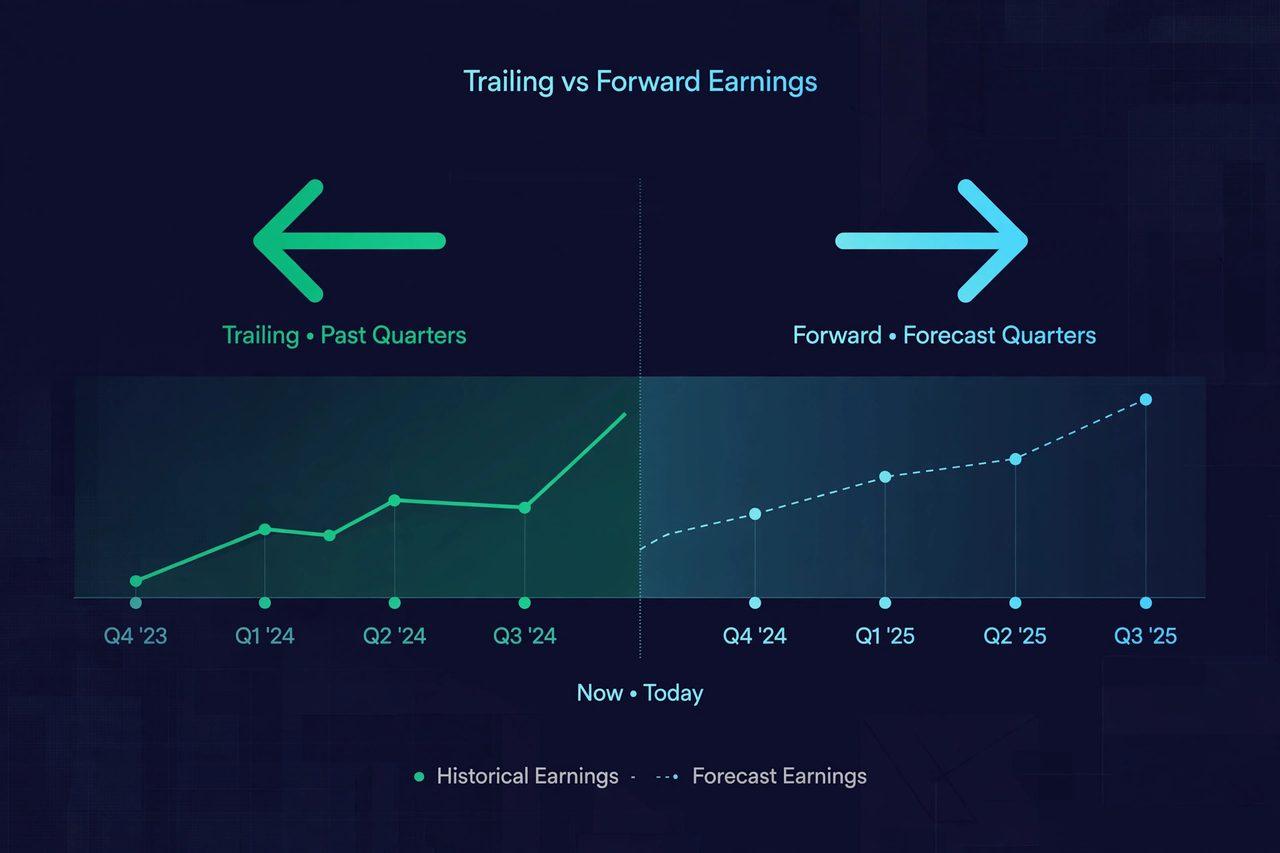
There are two versions you will see side by side on any finance site, and mixing them up causes most beginner errors. The trailing P/E uses actual reported earnings from the last twelve months — the last four reported quarters. The forward P/E uses analysts' estimates of earnings for the next twelve months. A stock can look cheap on one and expensive on the other, and the gap between them tells you something: if the forward P/E is much lower than the trailing P/E, the market expects earnings to grow; if it is higher, earnings are expected to shrink. Neither version works when earnings are negative — a loss-making company has no meaningful P/E, and finance sites show it as "not applicable" rather than a negative number. As a rough frame, ratios below 15 are generally considered low and ratios above 50 high, with the long-run average for US equities around 14–16 and the S&P 500 typically near 20 — but those averages are nearly useless without context, because what counts as normal differs wildly by sector.
How analysts actually use it — and where it misleads
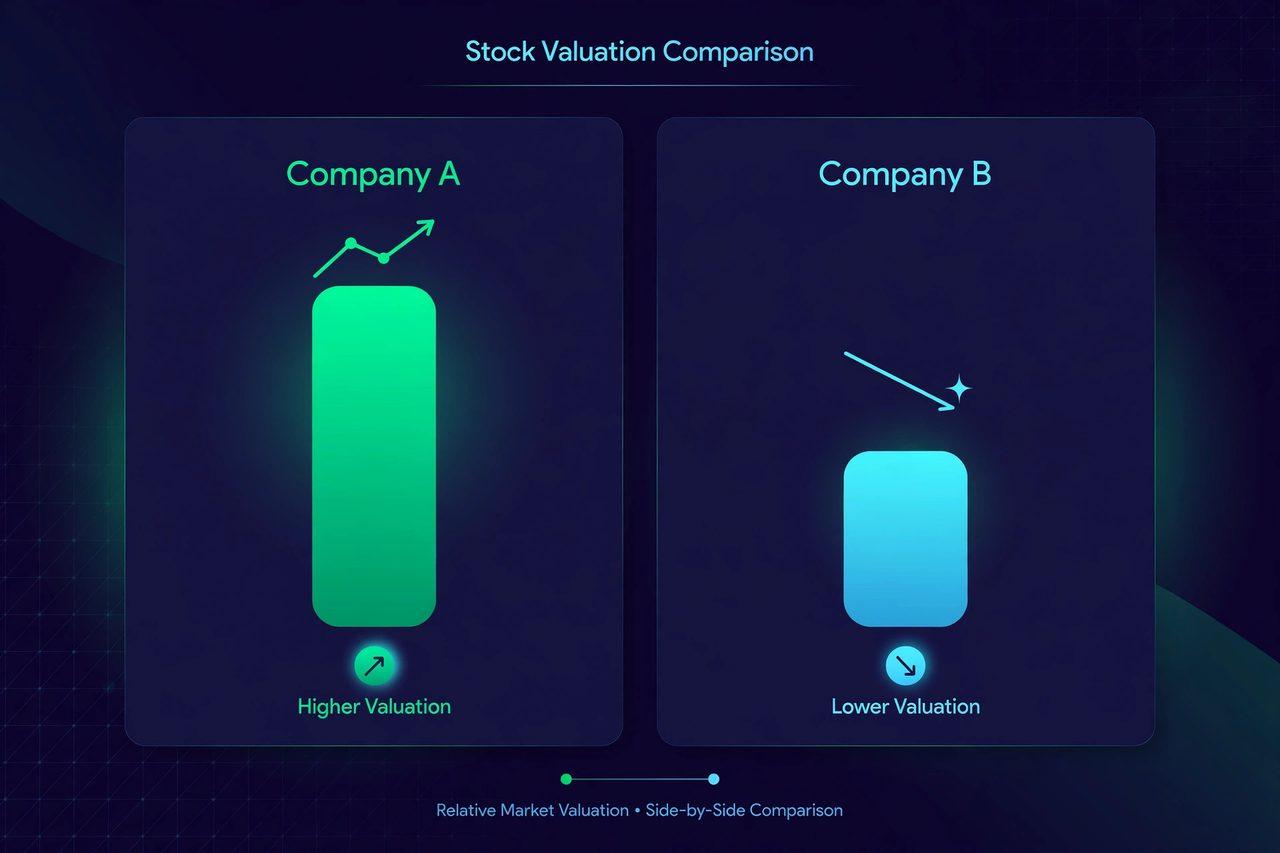
The correct use of a P/E is always comparative, never absolute. Compare a stock with its own history — is its P/E of 25 high for a company that usually trades at 15, or low for one that usually trades at 35? Compare it with its sector peers — a fast-growing software company at a P/E of 40 may be normal for its industry, while a mature utility at 40 would be a red flag. And compare it with the market — a stock trading well below the index average may be a bargain, or it may be cheap because the market expects its earnings to fall. Growth investors accept high P/E ratios because they are paying for future earnings growth; value investors hunt for low P/E ratios because they want tangible earnings today rather than promises about tomorrow. Both approaches work in different market conditions: high-P/E stocks tend to shine when growth is strong and interest rates are low, while low-P/E stocks tend to hold up better when uncertainty rises and rates climb, because their value rests on earnings that already exist.
Where the ratio misleads, it misleads in four predictable ways. First, one-off earnings: a company that sells a division books a huge one-time profit, its trailing P/E collapses, and it looks absurdly cheap — until the one-off drops out of the twelve-month window. Second, cyclical earnings: at the top of a cycle, a commodity or auto maker's earnings are inflated and its P/E looks tiny — precisely when the stock is most dangerous. Third, accounting choices: EPS depends on share counts (diluted EPS counts options and convertibles) and on what counts as earnings, so two companies' P/E ratios are only comparable if their earnings are measured the same way. Fourth, growth blindness: a P/E of 50 for a company growing earnings at 40% a year may be cheaper, in growth-adjusted terms, than a P/E of 15 for a company shrinking at 5% a year — which is why analysts also use the PEG ratio, the forward P/E divided by the expected earnings growth rate, where 1.00 means the price is in line with projected growth. The discipline that ties it together is a five-second routine before trusting any P/E: trailing or forward, peer or history comparison, one-off or recurring earnings, growth rate behind it, and what the sector norm is. A ratio that passes those checks is a genuine valuation signal. One that passes only the arithmetic deserves a second look. Follow stock analysis coverage on the Zimbuck News page and in the Zimbuck Market News group. For background, see the earnings-report reading guide and the stock chart reading guide. Wikipedia explains the price-to-earnings ratio. Join the conversation on Zimbuck to discuss which valuation metric you trust most — P/E, PEG, or something else entirely.
FAQ
What is a P/E ratio? The price-to-earnings ratio: a stock's share price divided by its earnings per share (EPS). A $100 stock earning $5 per share has a P/E of 20.
What is the difference between trailing and forward P/E? Trailing P/E uses actual reported earnings from the last 12 months; forward P/E uses analysts' estimates for the next 12 months.
What is a good P/E ratio? There is no universal "good" number — it depends on sector, growth and history. Roughly, below 15 is low and above 50 is high, with the US market average near 14–16 historically and the S&P 500 typically around 20.
Can a P/E ratio be negative? No — companies with losses have no meaningful P/E, shown as "not applicable". A negative ratio would be meaningless for valuation.
What is the PEG ratio? The forward P/E divided by the expected earnings growth rate. A PEG near 1.00 means the price is in line with projected growth; above 1.00 implies a premium, below 1.00 a discount.
Why is a low P/E stock not always a bargain? It may be cheap because the market expects earnings to fall, because earnings are temporarily inflated by a one-off gain, or because the company is at the top of a cyclical peak.
This article is market news and general information only, not financial advice.




