


What Is Bitcoin Dominance? How the BTC Dominance Chart Signals Altcoin Season

Bitcoin dominance is one of the most watched numbers in crypto. It tells you, in one percentage, how much of the entire crypto market belongs to Bitcoin — and, by extension, how much risk traders are willing to take elsewhere. When dominance rises, Bitcoin is usually leading. When it falls, altcoins are usually catching up, or even outperforming. That is why traders watch the BTC dominance chart alongside price charts, not instead of them.
Bitcoin dominance is calculated as Bitcoin's market capitalisation divided by the total market capitalisation of all cryptocurrencies, multiplied by 100. On November 2, 2026, that figure stood at about 60.0%, according to CoinMarketCap, with Bitcoin worth roughly $1.56 trillion out of a total crypto market of about $2.61 trillion. In other words, Bitcoin alone still accounted for roughly three-fifths of the value of the whole market, even after more than a decade of altcoin growth.
That headline number, however, depends on what you count. TradingView's BTC.D, the version most chartists quote, measures Bitcoin against only the top 125 cryptocurrencies. CoinMarketCap and CoinGecko, by contrast, track thousands of tokens. The broader the denominator, the lower dominance tends to look, because thousands of tiny tokens add up. Stablecoins also matter: with more than $300 billion in stablecoins in circulation, including them dilutes Bitcoin's share by roughly 6 to 8 percentage points compared with a measure that excludes them. None of these versions is wrong; they simply answer slightly different questions, so compare like with like and stick to one series when you track tre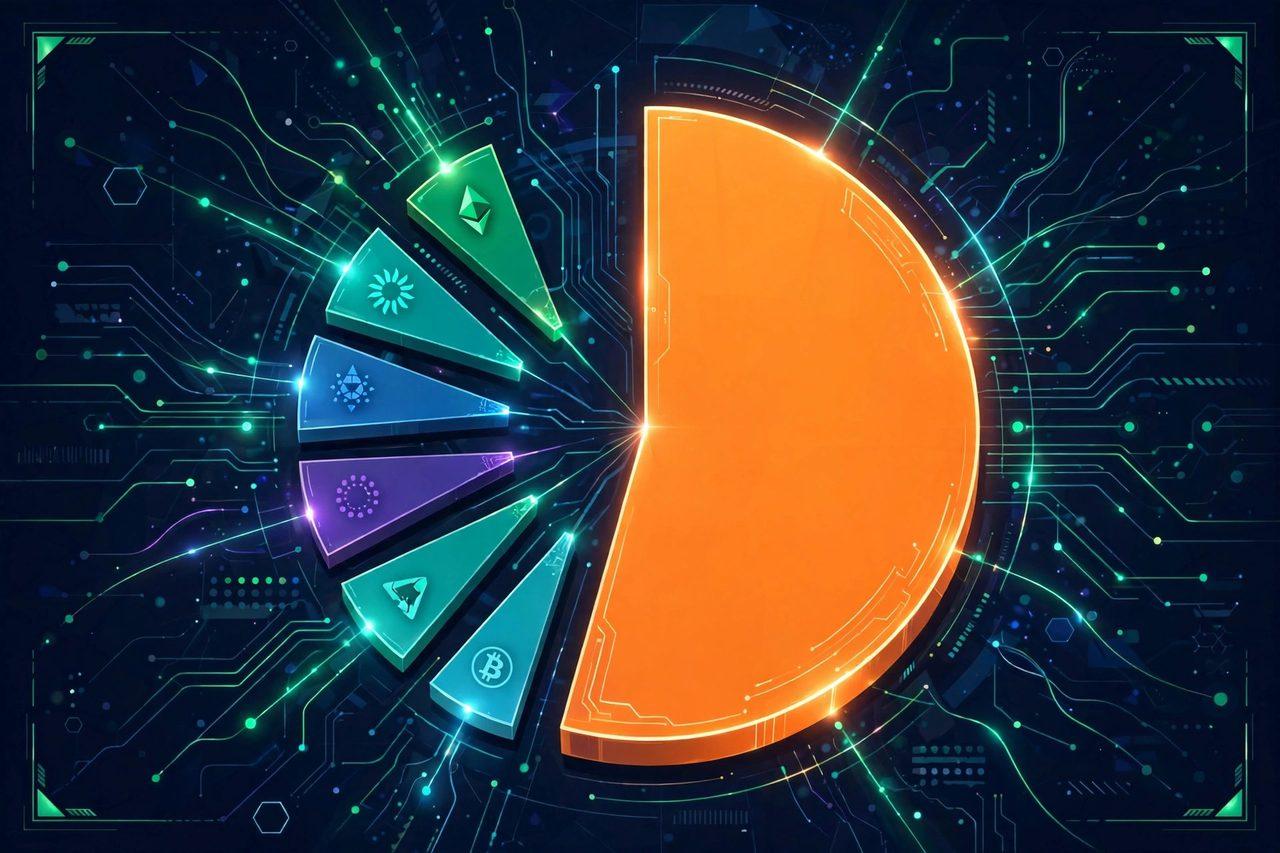 nds.
How to read the chart: four quadrants
Traders often combine dominance with total market capitalisation to read the market's mood. The combination gives four broad situations. First, dominance rising while total market capitalisation rises: Bitcoin is leading a growing market, usually a risk-on phase led by the largest asset. Second, dominance rising while total market capitalisation falls: money is retreating into Bitcoin as a relative safe haven within crypto, often during sell-offs. Third, dominance falling while total market capitalisation rises: capital is rotating into altcoins, the classic altcoin-season setup, as traders take Bitcoin profits and chase higher-beta tokens. Fourth, dominance falling while total market capitalisation falls: broad capitulation, where even Bitcoin cannot hold its share as money leaves crypto altogether.
No quadrant is a buy or sell signal on its own. A falling dominance reading during a rising market is encouraging for altcoin holders, but it can also simply reflect a single large altcoin — usually Ethereum — outperforming for a week. Likewise, rising dominance in a falling market is not bullish; it only says Bitcoin is falling more slowly than everything else. Context, trend and volume matter more than any single daily reading.
The altcoin season index, and why 75% matters
CoinMarketCap's Altcoin Season Index turns the dominance idea into a score. It compares the performance of the top 100 coins against Bitcoin over the previous 90 days. A reading of 75% or higher means altcoin season; 25% or lower means Bitcoin season. On November 2, 2026, the index stood at 47 — firmly in neutral territory, neither Bitcoin season nor altcoin season. Its 2026 high was 64, reached on September 27, which shows how close the market came to a genuine altcoin season earlier in the autumn without quite getting there.
Ethereum's share is the other number worth watching. In early October, ETH accounted for about 11.5% of the total crypto market. When Ethereum outperforms Bitcoin for a sustained period, dominance usually falls even if smaller altcoins do nothing, because ETH is the second-largest asset by a wide margin. A falling dominance driven mainly by ETH is a different market from one driven by dozens of small tokens rising together.
A floor that has held since 2024
One longer-term observation stands out: dominance has held above a 50% floor since spot Bitcoin ETFs launched in 2024. That does not mean altcoins have failed — many have grown in absolute terms — but it does mean Bitcoin has kept at least half the market's value through every rotation since institutional access widened. For long-term investors, that floor is a reminder of how concentrated crypto still is, despite its diversity.
Key takeaways
- Bitcoin dominance = Bitcoin market cap divided by total crypto market cap, times 100.
- About 60.0% on November 2, 2026: roughly $1.56 trillion of $2.61 trillion.
- TradingView counts the top 125 coins; CoinMarketCap and CoinGecko count thousands, and stablecoins above $300 billion dilute the share by about 6 to 8 percentage points.
- Altcoin season needs an index reading of 75% or higher; Bitcoin season is 25% or lower. The reading was 47 on November 2, 2026, with a 2026 high of 64 on September 27.
- Read dominance together with total market capitalisation: the four quadrants tell you whether money is entering, leaving, rotating or capitulating.
Frequently asked questions
What is a good Bitcoin dominance level? There is no ideal level. Above 60% usually means Bitcoin-led markets; below 50% usually means broader altcoin participation. What matters is the direction and what total market capitalisation is doing at the same time.
Does falling dominance mean altcoin season? Not necessarily. Dominance can fall because one large asset, such as Ethereum at about 11.5% in early October, outperforms. The Altcoin Season Index, which requires broad outperformance across the top 100 coins, is a stricter test.
Why do different sites show different dominance numbers? Because they count different coins. TradingView's top-125 measure differs from CoinMarketCap's thousands-of-tokens measure, and including or excluding stablecoins changes the result by several percentage points.
Further reading
Read the Zimbuck News page, join the discussion in the Zimbuck Market News group, and see our related live Bitcoin market coverage: Bitcoin Holds $76,000 as Price Analysis Points to $80,225 — https://zimbuck.com/blogs/1195/Bitcoin-Holds-76-000-as-Price-Analysis-Points-to-80 — plus an authoritative explainer on Bitcoin dominance at https://blockchainreporter.net/bitcoin-dominance/ . Keep following Zimbuck News at https://zimbuck.com/pages/zimbucknews and the Zimbuck Market News group at https://zimbuck.com/groups/zimbuckmarketnews , and join us at https://zimbuck.com .
This article is for education only and is not financial advice. Cryptocurrency prices are volatile, and dominance readings are indicators, not predictions.




