

Contango and Backwardation Explained: How Commodity Futures Curves Work — and What They Tell Traders

The futures curve: one commodity, many prices
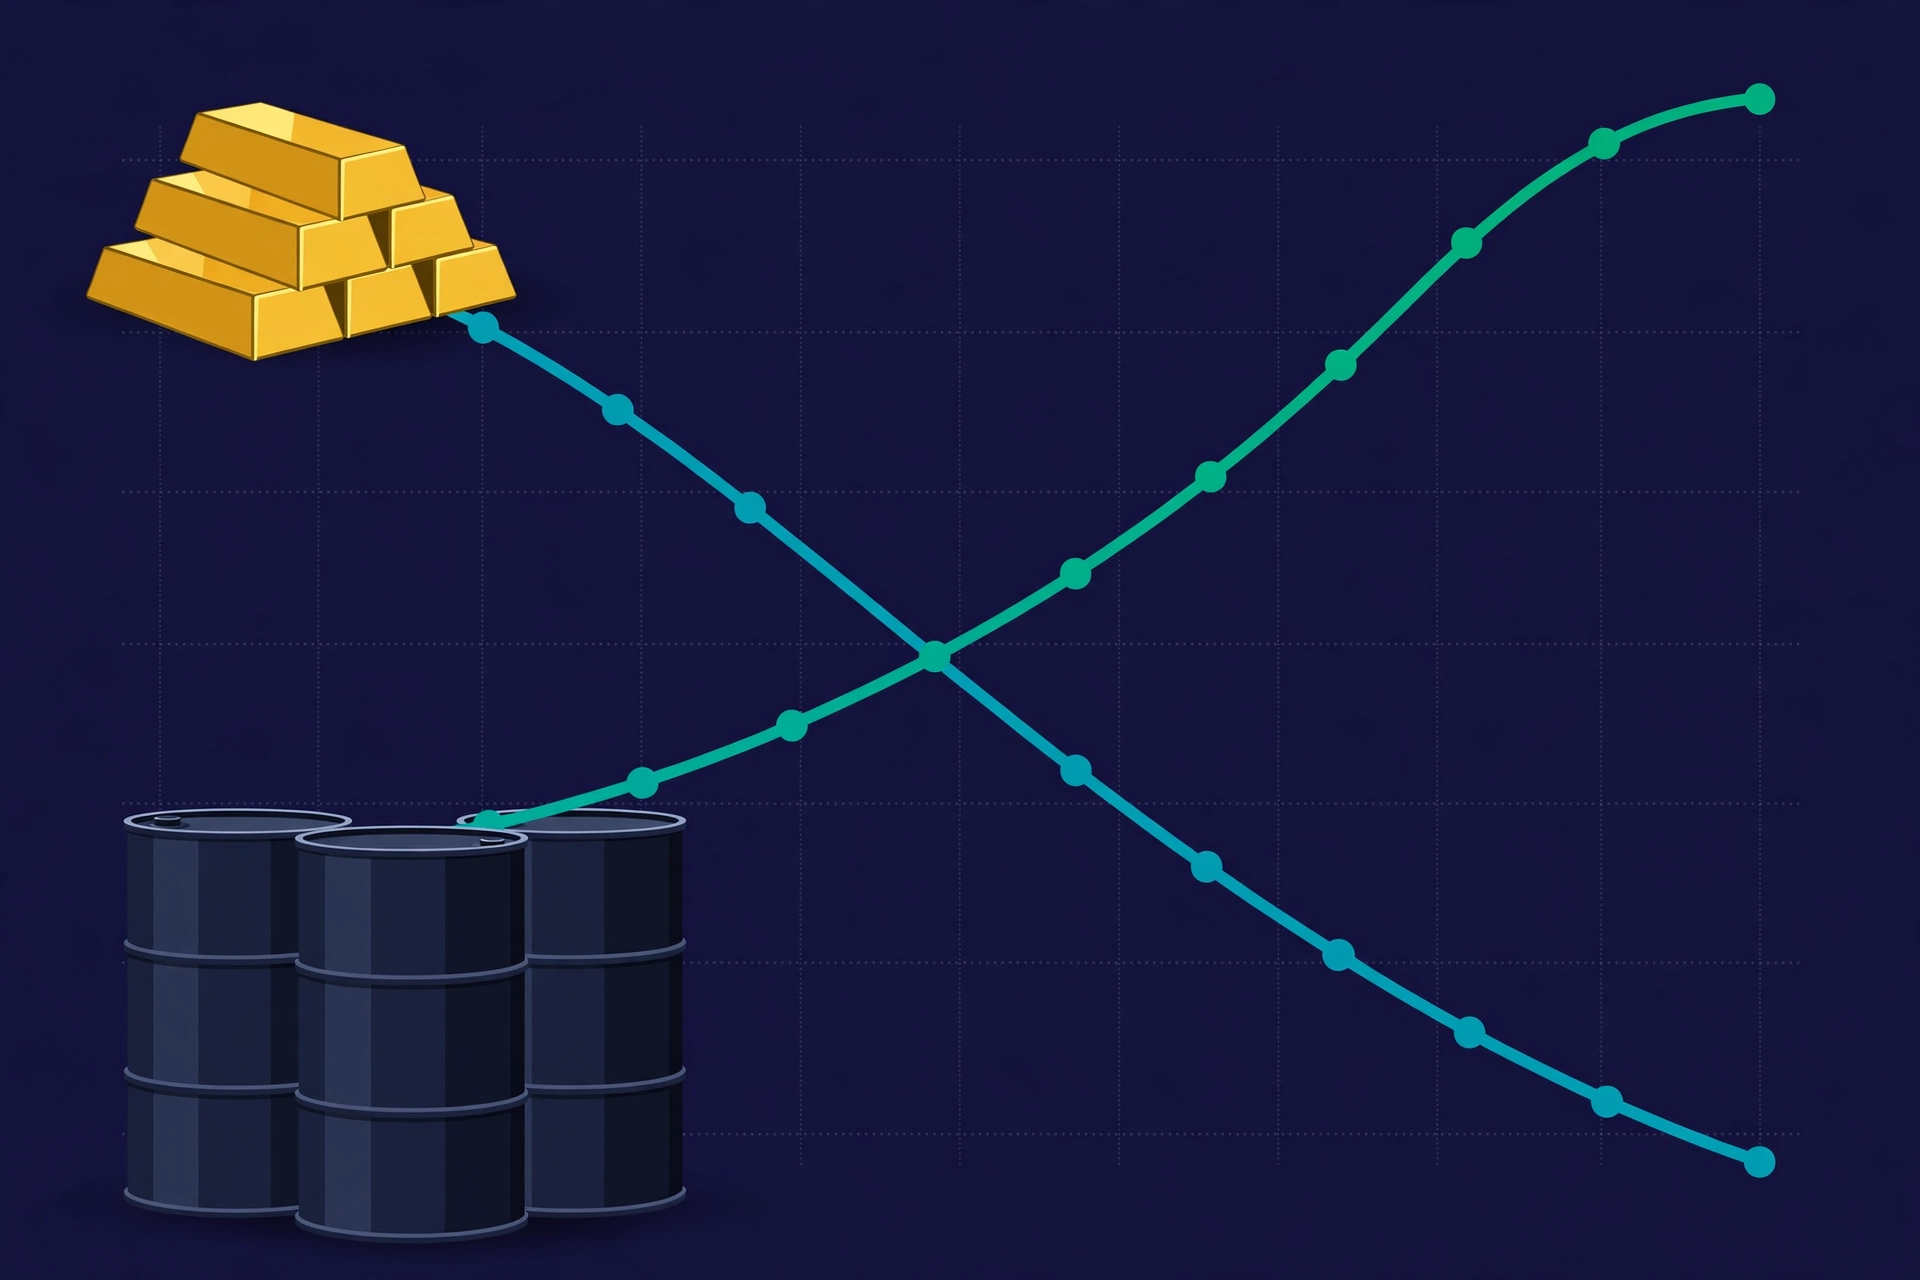
Traders often talk about "the price of oil" as if it were one number. In the futures market it is dozens of numbers at once. A futures contract is an agreement to buy or sell a commodity at a set price on a future date, and contracts exist for many delivery months — next month, the month after, six months out, a year out. Plot those prices against their delivery dates and you get the futures curve, also called the forward curve or term structure. Its shape is one of the most useful signals in commodity markets, and also one of the most misunderstood. Two shapes dominate. In contango, later delivery months are priced above nearer ones, so the curve slopes upward. In backwardation, later months are priced below nearer ones, so the curve slopes downward. The two terms say nothing, on their own, about whether the price of the commodity is rising or falling. They describe how the market prices time: what it costs to receive the commodity later instead of now. That distinction — shape versus direction — is the key to everything that follows.
Contango: paying to wait
Imagine Brent crude oil trading at $70 per barrel for delivery next month, while a contract expiring two months later trades at $75. That is contango: the market charges more for later delivery. The reason is cost of carry — holding a physical commodity costs money. You pay for storage, insurance, financing, and transportation. If you buy oil today and store it for two months, you must recover those costs when you sell it, so the future price sits above the spot price by roughly the cost of carrying it. Contango frequently develops when physical supplies are plentiful relative to immediate demand: producers and traders prefer to store surplus rather than sell it immediately, provided the premium in futures contracts compensates them for carrying inventory. There is a mechanical consequence for anyone holding a long futures position. As a contract nears expiry, its price converges toward the spot price. If the spot price stays flat at $70, a contract bought at $75 will drift down toward $70 by expiry — a loss from convergence alone, before any view on oil is even tested. This is called negative roll yield, and it is why long-only commodity funds in steep contango can lose money even in a flat market: each month they sell the expiring contract and buy a more expensive later one, paying the curve's slope as a running cost.
Backwardation: paying for immediacy
Backwardation is the mirror image. Imagine crude oil at $90 per barrel for spot delivery, while a contract for delivery two months later trades at $85. The market is paying a premium for immediacy: buyers will pay more to have the commodity now than to wait. Backwardation typically signals tight near-term supply — inventories are low, or demand right now is urgent — so the market rewards anyone willing to release stock from storage today rather than hold it. The convergence mechanics run in reverse: if the spot price stays flat at $90, a contract bought at $85 drifts up toward $90 by expiry, giving a long holder positive roll yield. That is one reason commodity traders watch backwardation closely: it can add return on top of any price move, and it reflects a physical reality — scarcity now — that a price chart alone does not show. Keynes, in his 1930 Treatise on Money, called backwardation the "normal" state of commodity markets, arguing that producers hedge more than consumers; in oil, backwardation has historically been the more common shape, partly because contango can be arbitraged away by building storage and selling forward, while backwardation cannot be arbitraged away — you cannot borrow a barrel from the future and deliver it today. A curve can also be mixed: in contango at the front and backwardation further out, or flat where months are equal, because each segment has its own slope driven by its own supply and demand.
Reading the curve in five steps
First, compare a near month with a later month and measure the gap as a percentage — for example, a 3-month contract at 81.50 against a 1-month contract at 80.00 is a premium of 1.875 percent over three months, about 7.5 percent annualised — and remember that annualised figure is a comparison tool, not a rate anyone earns. Second, ask what is driving the shape: storage costs and ample supply point to contango; tight inventories and urgent demand point to backwardation. Third, check whether the shape is broad across the curve or only at the front, because a front-month spike from a temporary disruption reads differently from a whole curve sloping one way. Fourth, separate the curve from the price: a backwardated market can still fall if spot prices collapse, and a contango market can still rise if spot prices surge — the curve tells you about time and storage, not about tomorrow's direction. Fifth, if you invest through an ETF or ETN that holds futures rather than the physical commodity, check its roll method: in contango it pays the slope every roll, in backwardation it collects it, and that drag or tailwind compounds month after month. The current market gives a live backdrop for this reading, not a curve call: on November 2, Brent traded around $110 a barrel and WTI near $101 after falling more than 3 percent on Iran talks, gold steadied near $3,900 an ounce after a bruising October, and silver traded near $50 — each of those spot prices has its own futures curve behind it, and the curve, not the spot price alone, tells you what storing, delivering and rolling that commodity actually costs.
FAQ
What is contango? A futures market in which later delivery months are priced above nearer ones, so the curve slopes upward — typically reflecting storage, insurance and financing costs.
What is backwardation? The opposite: later months priced below nearer ones, so the curve slopes downward — typically reflecting tight near-term supply and a premium for immediate delivery.
Does contango mean prices will rise? No — the curve shape describes how the market prices time and storage, not the future direction of the spot price.
What is roll yield? The gain or loss from a futures price converging toward spot as expiry approaches: negative in contango for a long holder if spot is flat, positive in backwardation.
Why do commodity ETFs sometimes lag the commodity? Because funds holding futures must roll contracts each month, paying the curve's slope in contango or collecting it in backwardation, on top of any spot price move.
Can a curve be mixed? Yes — it can be in contango at the front and backwardation further out, or flat, because each segment reflects its own supply and demand.
Read more on Zimbuck: https://zimbuck.com/pages/zimbucknews and join the discussion at https://zimbuck.com/groups/zimbuckmarketnews . Related reading on the site: the "What Moves Oil Prices?" guide in the Commodities category.
This article is market news and general information only, not financial advice.




