

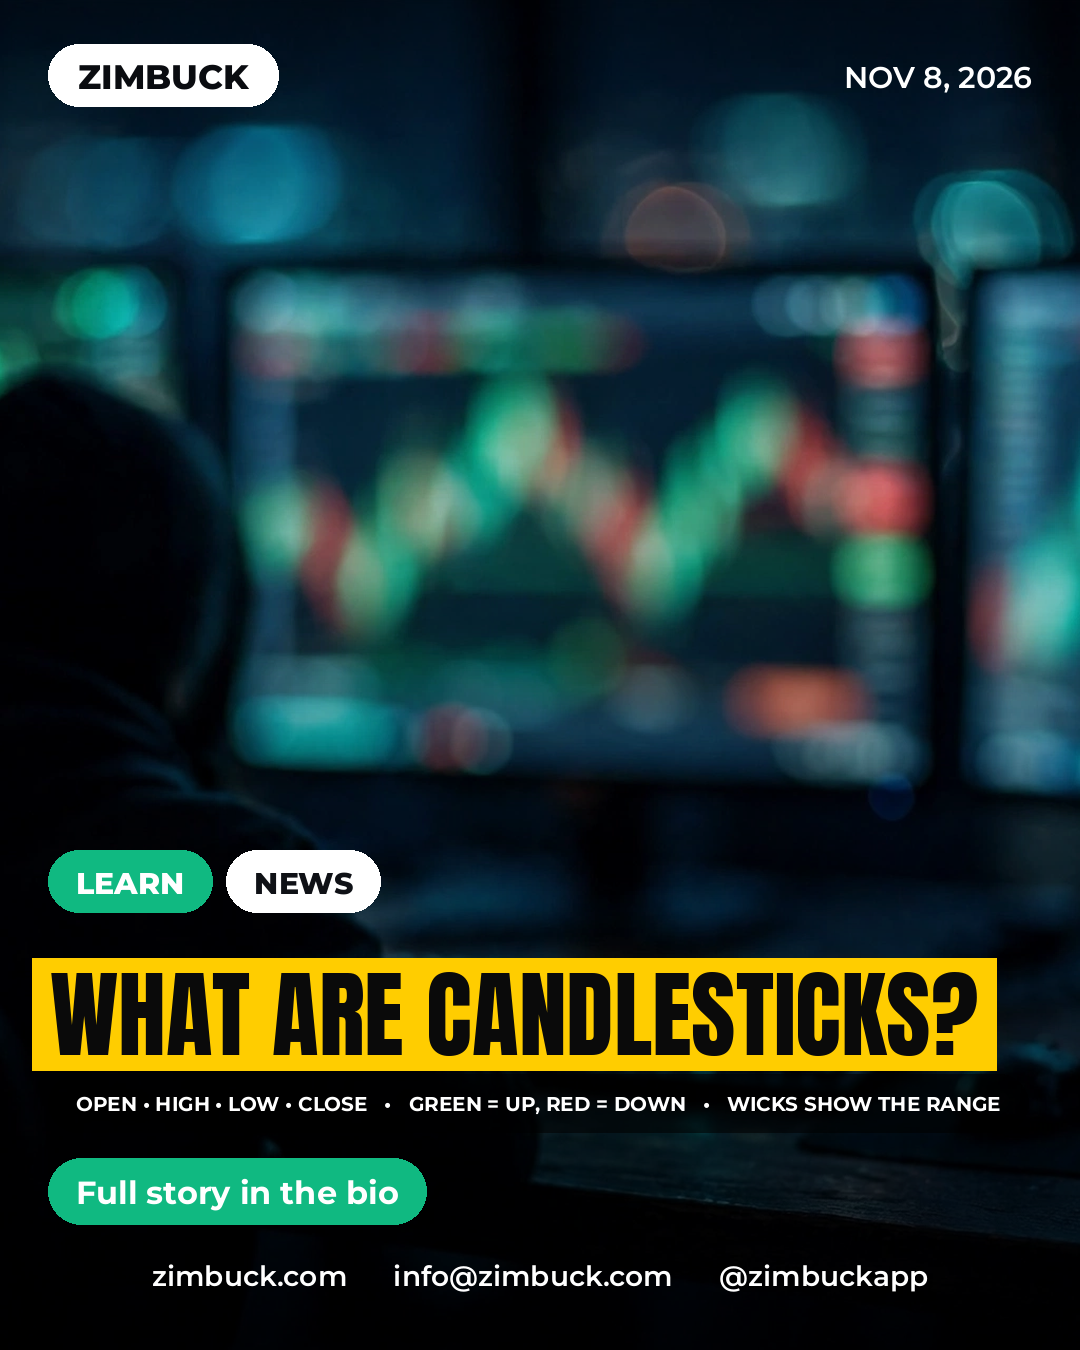
📚 WHAT ARE CANDLESTICKS?
A candlestick is one bar on a price chart that packs four prices into a single shape — where the price opened, the highest it reached, the lowest it fell, and where it closed in that period.
🕯️ The body shows the open-to-close move — green when the close is higher, red when it is lower
📏 The thin wicks show the full high-to-low range the price travelled
⏱️ Each candle covers one period — a minute, an hour, a day — depending on your chart setting
🔍 Long wicks and big bodies help traders read momentum and indecision at a glance
Once you can read candles, every chart starts telling you a story.
#Candlesticks #LearnTrading #TechnicalAnalysis #Crypto #Stocks #Zimbuck
A candlestick is one bar on a price chart that packs four prices into a single shape — where the price opened, the highest it reached, the lowest it fell, and where it closed in that period.
🕯️ The body shows the open-to-close move — green when the close is higher, red when it is lower
📏 The thin wicks show the full high-to-low range the price travelled
⏱️ Each candle covers one period — a minute, an hour, a day — depending on your chart setting
🔍 Long wicks and big bodies help traders read momentum and indecision at a glance
Once you can read candles, every chart starts telling you a story.
#Candlesticks #LearnTrading #TechnicalAnalysis #Crypto #Stocks #Zimbuck


281 Views




