
📚 WHAT IS RSI?
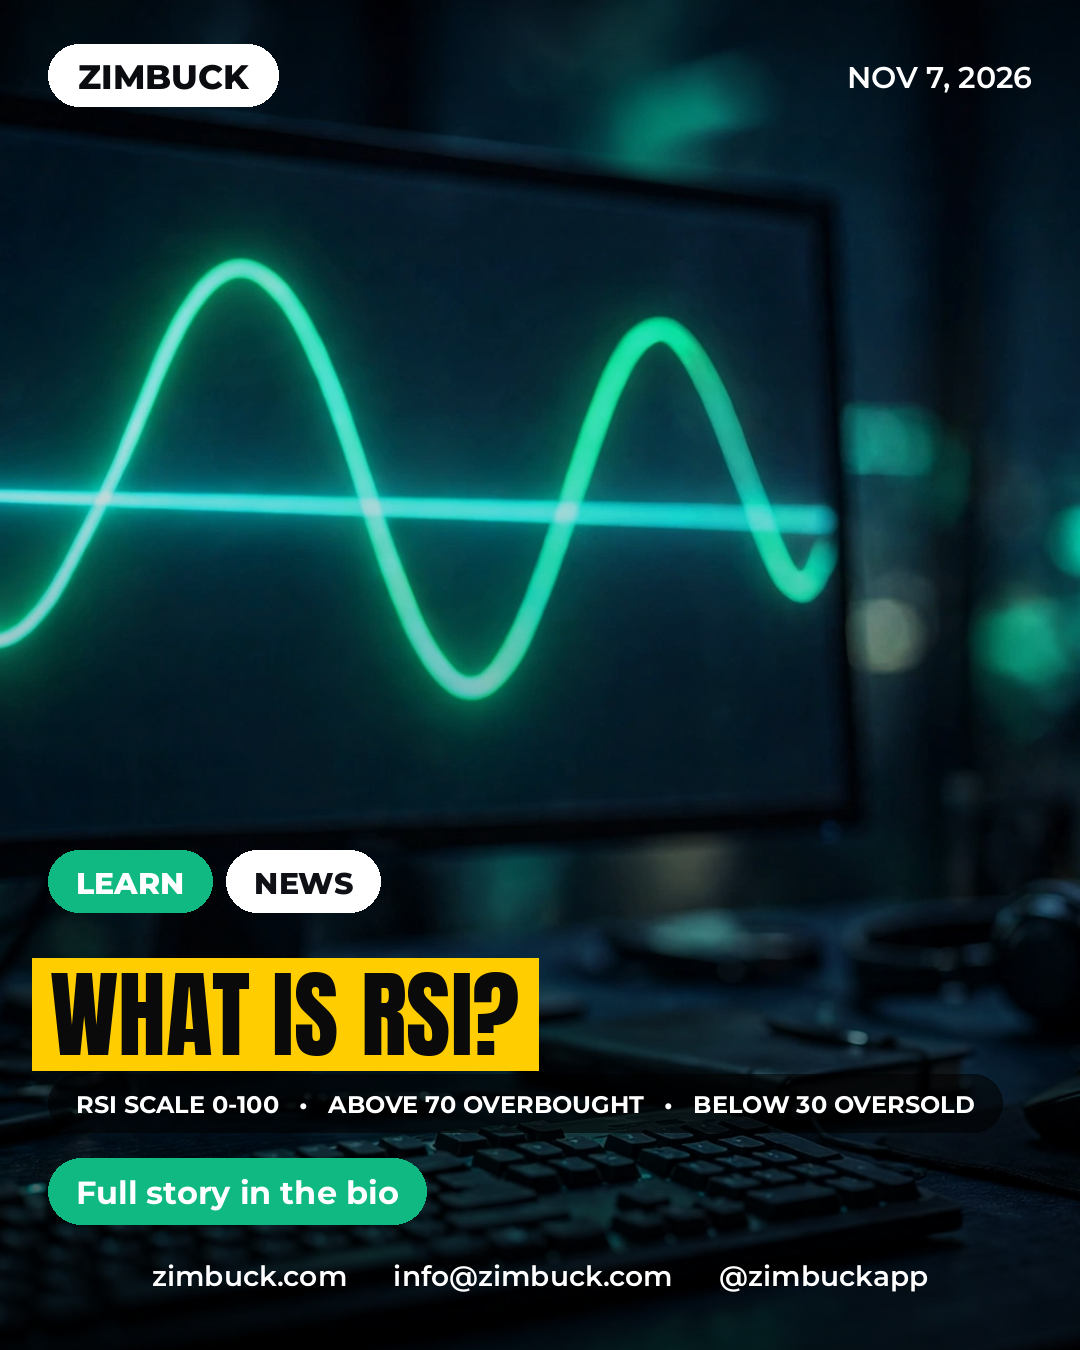
The Relative Strength Index (RSI) is a momentum indicator that measures how fast and how far a price has moved, on a scale from 0 to 100.
📈 Above 70 is traditionally read as overbought — buyers may be exhausted
📉 Below 30 is traditionally read as oversold — sellers may be exhausted
⏱️ The standard setting uses 14 periods, developed by J. Welles Wilder in 1978
RSI does not predict price on its own — traders use it alongside trend, volume and support/resistance to judge whether a move is stretched.
#RSI #LearnCrypto #Trading #TechnicalAnalysis #Bitcoin #Stocks #Zimbuck
The Relative Strength Index (RSI) is a momentum indicator that measures how fast and how far a price has moved, on a scale from 0 to 100.
📈 Above 70 is traditionally read as overbought — buyers may be exhausted
📉 Below 30 is traditionally read as oversold — sellers may be exhausted
⏱️ The standard setting uses 14 periods, developed by J. Welles Wilder in 1978
RSI does not predict price on its own — traders use it alongside trend, volume and support/resistance to judge whether a move is stretched.
#RSI #LearnCrypto #Trading #TechnicalAnalysis #Bitcoin #Stocks #Zimbuck


115 Visualizações