

Bitcoin Support and Resistance Explained: How to Read Levels, Moving Averages and RSI Without Fooling Yourself

Every Bitcoin chart is covered in lines: support here, resistance there, a moving average overhead, an RSI reading below. Beginners treat those lines as walls. Experienced traders treat them as questions. A level is not a prediction; it is a place where buyers or sellers have acted before, and where you can test whether they will act again. This guide teaches the method: how a level is built, how a test is confirmed, how moving averages and momentum indicators confirm or contradict it, and the discipline that stops a level from fooling you.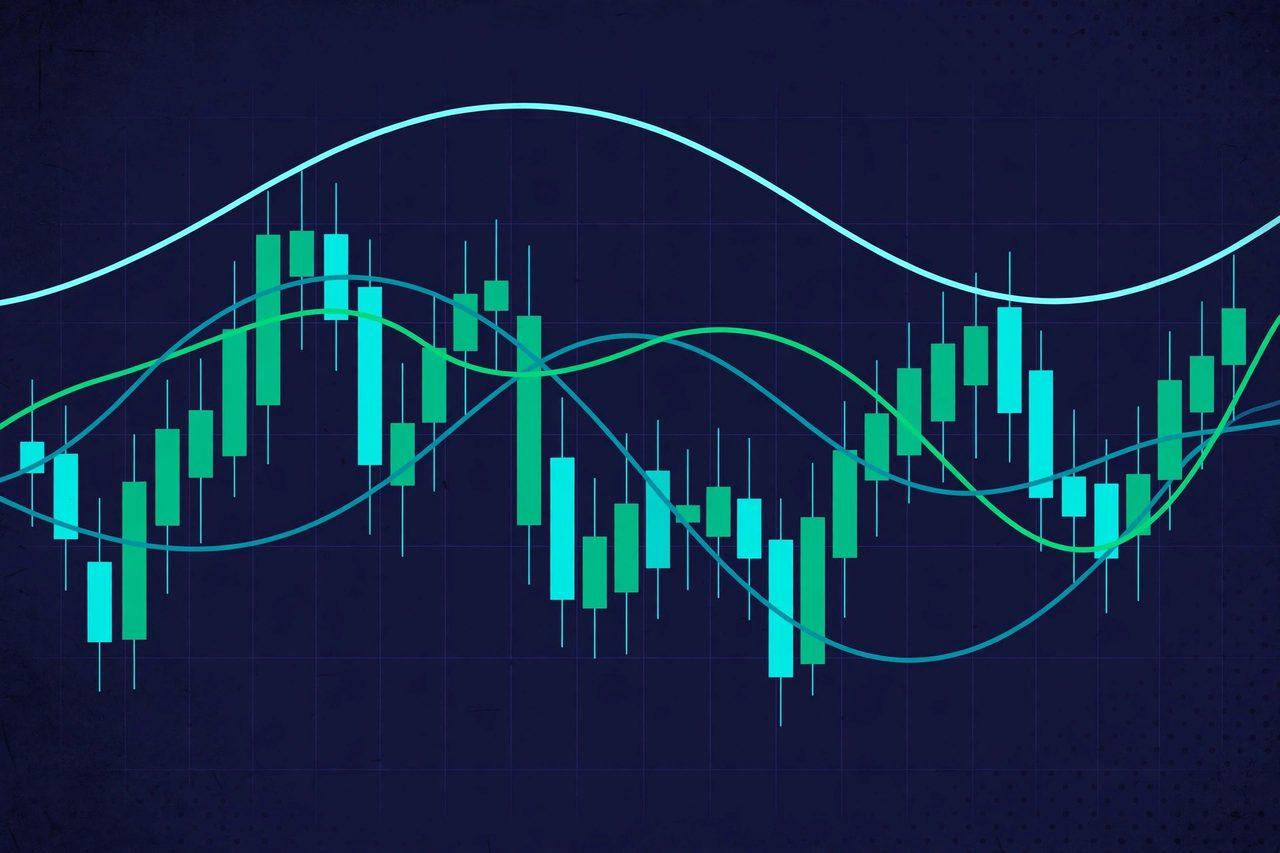 What support and resistance actually are. Support is a price area where buying has repeatedly overwhelmed selling, so declines stall there. Resistance is the mirror image: an area where selling has repeatedly overwhelmed buying, so rallies stall there. Levels form from memory — previous highs and lows, round numbers, and areas where a lot of trading happened. Take Bitcoin in early November 2026 as a worked example. Analysts flagged about $75,597, the 50-week simple moving average, as the key support below the price, and about $78,661, the 61.8% Fibonacci retracement level, as the first resistance a recovery must reclaim. Below that sat the previous week's low near $76,141 and the 200-day average near $73,152; above sat the 50-day average near $80,287 and the September high near $87,397. None of those numbers is magic. Each one is simply a place where, for a stated reason — a long average, a Fibonacci ratio, a prior high — traders are watching for a reaction.How to test a level: touches, closes and invalidation. A level is tested when price reaches it, and the test has three possible outcomes. A hold means price touches the level and turns away, ideally on a daily close back on the right side of it. A break means price closes through the level and stays there — one wick through a level is not a break, it is a probe. A retest means price breaks a level, then comes back to it from the other side and is rejected there, confirming the level has flipped roles: old support becomes new resistance, and vice versa. The discipline is to decide your invalidation price before you act. If you buy near support at $75,597, your invalidation is a daily close clearly below it — not a feeling, not a headline, a close. If you sell near resistance at $78,661, your invalidation is a daily close clearly above it. A level without an invalidation price is not analysis; it is a wish.Moving averages: the ceiling above the price. Moving averages turn a level into a trend picture. When Bitcoin trades below its short- and medium-term averages, those averages become overhead resistance — a ceiling the price must climb through, one average at a time. In early November, Bitcoin sat below its 7-day average near $78,822, its 20-day near $80,688 and its 50-day near $82,009, while holding well above its 200-day average near $73,212. That stack tells a clear story: the short-term trend is down, the long-term structure is intact, and the distance between them — roughly $5,000 to the 200-day average — is room, not safety. The practical rule is simple: in a stack like this, rallies toward the nearest average (the 7-day, then the 20-day) are where sellers have repeatedly appeared, so a recovery is not confirmed until price closes back above the stack, not merely touches it. The 200-day average near $76,466 on one measure, and the 100-day average near $76,647 on another, sat close to the price itself in early November — a cluster of averages near the price means the next few sessions, not the next few months, decide the direction.
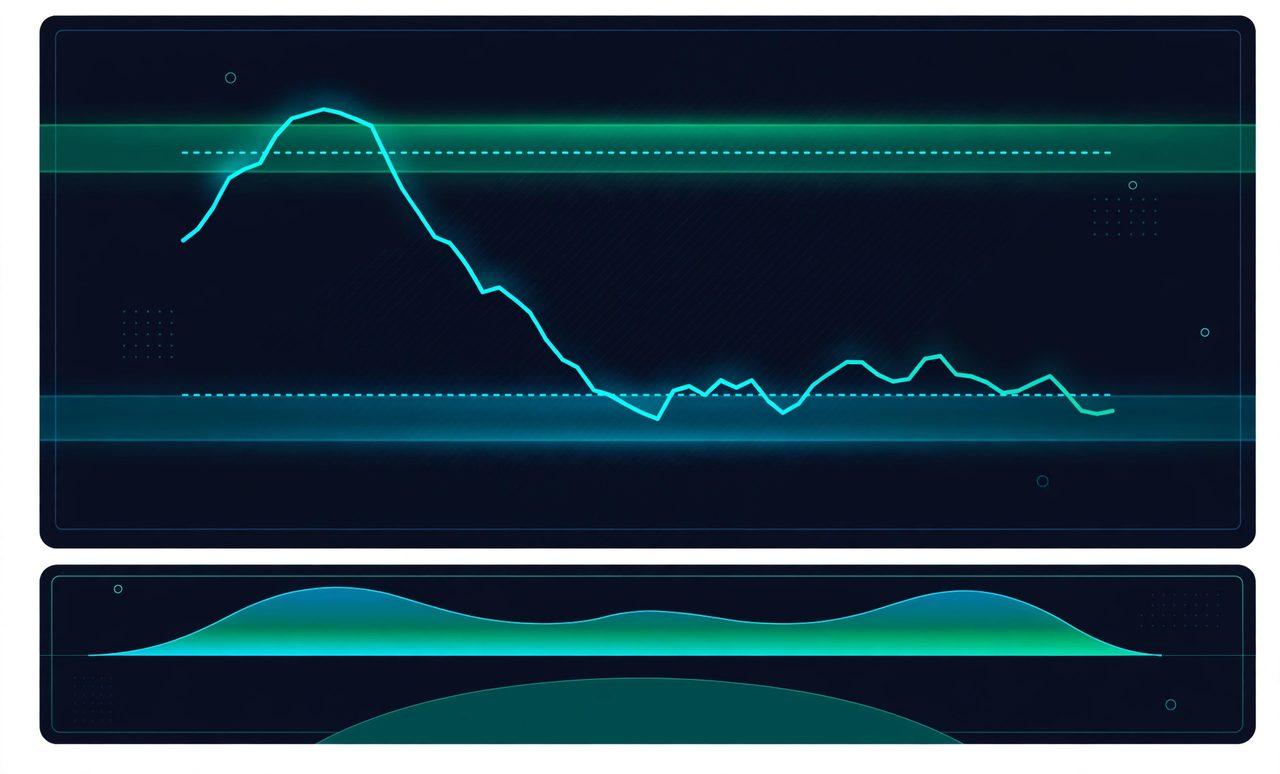 Momentum: what RSI near 34 does and does not say. The relative strength index (RSI) measures how strong recent gains have been against recent losses, on a 0–100 scale. Readings below 30 are conventionally called oversold; above 70, overbought. Bitcoin's daily RSI sat near 34 in early November, with the stochastic oscillator below 20 — weak momentum, approaching oversold, but not there yet. The beginner's mistake is to treat "near oversold" as "must bounce". Oversold markets can stay oversold for a long time, and in a downtrend a low RSI often just confirms selling pressure. Use RSI as a filter, not a trigger: a bounce from support is more credible when RSI is turning up from a low reading than when it is still falling; a rally into resistance is more suspect when RSI is already stretched. Combine, never rely on one: a level + a moving-average reclaim + RSI turning up is a case; any one of them alone is a hint.The five-check routine before trusting any level. First, is the level visible on the daily chart, not just a 15-minute wick? Daily levels matter more than intraday ones. Second, has price reacted there at least twice before? One touch is coincidence; two or three touches build a level. Third, does the level agree with another tool — a moving average, a Fibonacci level, a prior high or low — or does it stand alone? Confluence beats a single line. Fourth, what is the invalidation close, and what happens if it prints? Fifth, what is the average daily range — about $1,880 for Bitcoin in early November — relative to the distance to the level? If the level sits well inside one normal day's range, it will be tested and broken by noise alone, and it deserves less weight. Run those five checks and a chart stops being a forest of lines and becomes what it should be: a short list of places where a decision can be tested, with a price that proves you wrong.FAQ: What is support? A price area where buying has repeatedly stopped declines; resistance is the mirror image, where selling has repeatedly stopped rallies. What counts as breaking a level? A daily close through it that holds — a single wick through a level is a probe, not a break; a retest from the other side confirms the flip. Why do moving averages act as resistance? When price trades below its 7-, 20- and 50-day averages, each average is a level where sellers have recently appeared, forming a ceiling the price must close above to confirm a recovery. What does RSI near 34 mean? Weak momentum approaching oversold (below 30) but not there — a filter for a bounce's credibility, not a buy signal on its own. What is confluence? When a level agrees with another tool — a moving average, Fibonacci level or prior high/low — making it more significant than a lone line. What is an invalidation price? The close that proves your reading wrong, decided before you act — for example, a daily close clearly below support, or clearly above resistance.Read more on Zimbuck: the Nov 3 Bitcoin levels news analysis is here, https://zimbuck.com/blogs/1009/Bitcoin-s-76-000-Line-in-the-Sand-The-Levels — plus the Zimbuck News page at https://zimbuck.com/pages/zimbucknews and discussion at https://zimbuck.com/groups/zimbuckmarketnews . The Nov 3 levels analysis this guide uses as worked examples is here: https://invezz.com/news/2026/11/03/bitcoin-price-approaches-75600-danger-zone-as-etf-investors-pull-398m/ . This is general information and education only, not financial advice. Join Zimbuck at https://zimbuck.com to follow more price analysis.




