


How to Read a Stock Chart: Candlesticks, Support, Resistance and Volume Explained

Every stock chart tells the same story in pictures: who has been winning, where the battles happened, and whether anything is changing. Learning to read one is not about predicting the future — it is about seeing the story so far. This guide covers the chart itself: candlesticks, trends, support and resistance, and volume, so a beginner can open any chart and know what to look at first.
A stock chart plots price on the vertical axis and time on the horizontal axis. That simple frame supports everything else: each bar or candle summarizes one period — a minute, an hour, a day, or a week — and the sequence of periods shows the trend.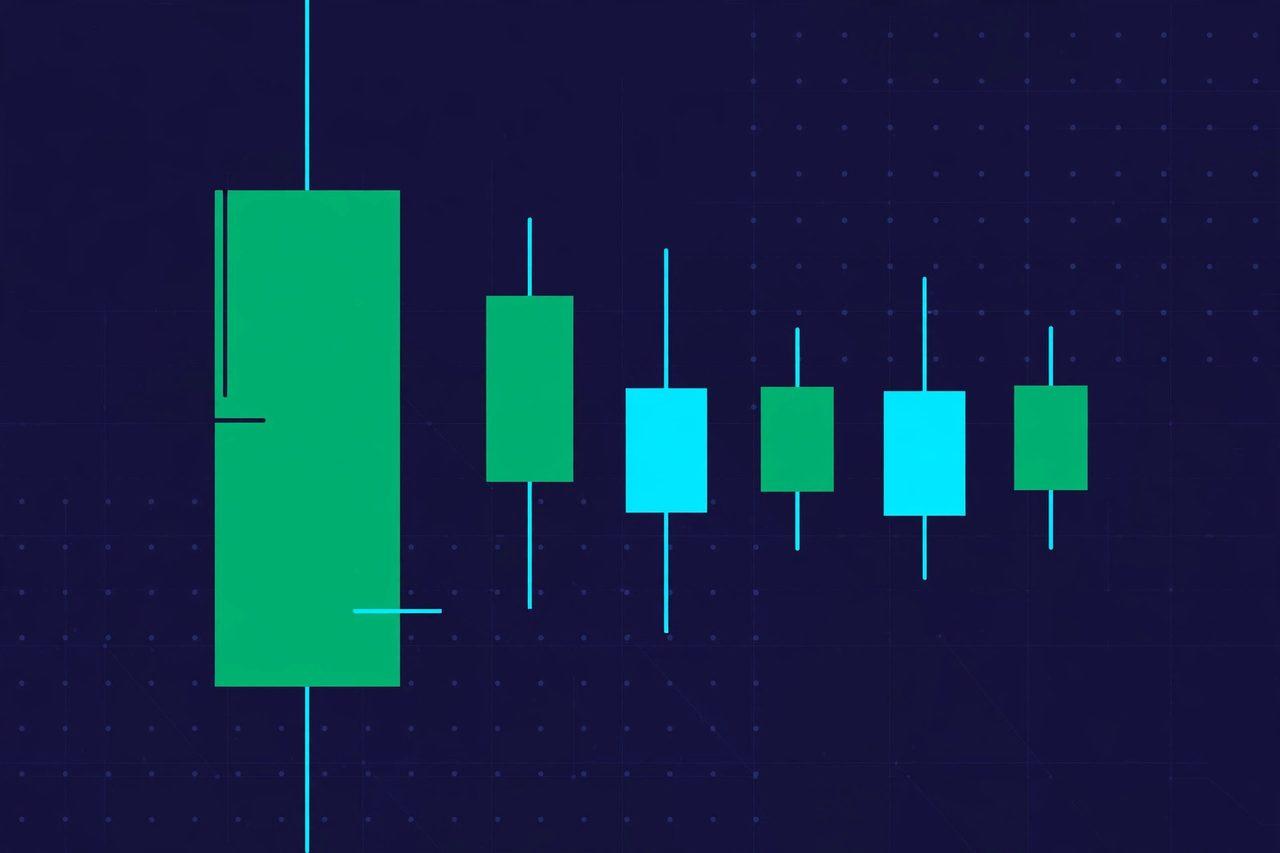
Candlesticks: four prices in one bar
Most modern charts use candlesticks. Each candle summarizes one period with four prices — open, high, low, close (OHLC). The thick body spans open to close: green (or white) when the close is higher, meaning buyers won the period; red (or black) when lower, meaning sellers won. The thin wicks show the high and low reached during the period.
The shapes are legible once you know the grammar. A long green body with almost no wicks is total buyer control. A long upper wick on a small body says buyers pushed high and got rejected — sellers stepped in at that level. A single candle means little on its own; candles matter in context, at levels, and with volume behind them.
Line charts and bar charts show the same data differently: a line chart connects closing prices for the cleanest big-picture view, while bar charts show OHLC with ticks instead of bodies. Beginners should start with candlesticks — they carry the most information per bar.
Trends: the direction of the story
Before any detail, zoom out. On a daily or weekly chart covering one to two years, ask: is the price making higher highs and higher lows (an uptrend), lower highs and lower lows (a downtrend), or moving sideways (a range)? The trend is the backdrop for every other reading. Trading with the trend is more forgiving than trading against it, and most beginner mistakes come from fighting a clear trend on a short timeframe while ignoring the longer one.
Support and resistance: the market's memory
Support is a price area where declines have repeatedly stopped — buyers remember it as cheap. Resistance is where advances have stalled — sellers remember it as expensive. These levels form at prior highs and lows, round numbers, and heavy-volume zones, and they matter because thousands of participants remember the same picture and act on it.
Key rules for reading levels:
Levels are zones, not exact lines — expect reactions near a level, not to the cent.
The more times a level holds, the more significant it becomes — but also the weaker it gets with each test.
When a level finally breaks decisively on strong volume, old resistance often becomes new support (and vice versa) — this "role reversal" is one of the most reliable chart behaviors.
A break on thin volume is suspect; a break on heavy volume has conviction behind it.
Readers who want the same idea applied to crypto can compare this guide with the site's Bitcoin support-and-resistance explainer and its Bitcoin $76,000 levels analysis — the levels logic is identical, only the asset changes.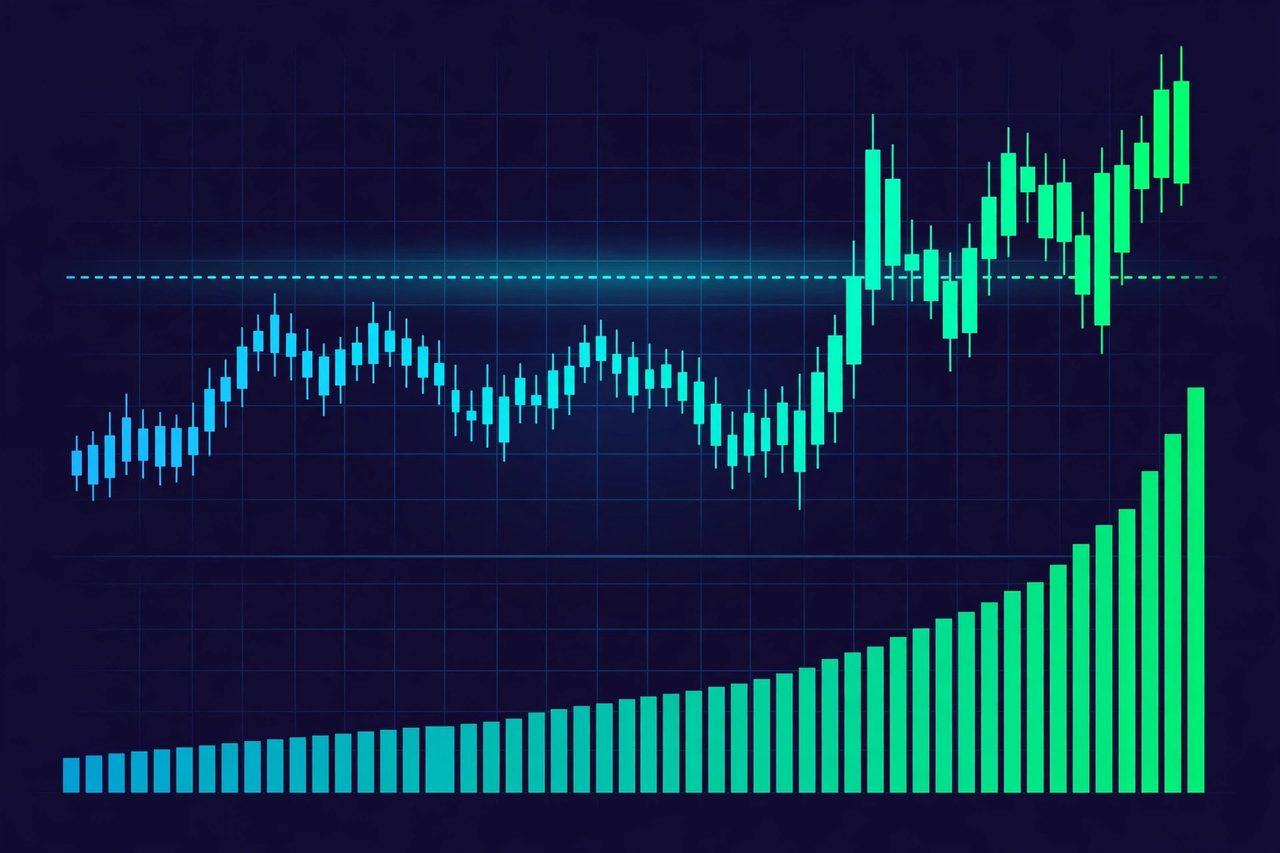
Volume: the conviction meter
The bar chart along the bottom is volume — how many shares traded each period. Price says what happened; volume says how many people meant it. A breakout on triple average volume has crowds behind it; the same move on thin volume is a rumor. As a rule of thumb, healthy trends see volume expand in the trend's direction and fade on pullbacks.
Watch volume especially at levels: high volume on a breakout confirms the move is more likely genuine than a false alarm, while a breakout on fading volume often reverses back into the range. In a downtrend, the mirror applies — heavy volume on down days confirms selling pressure.
Reading a chart in 30 seconds
1. Zoom out (1–2 years, daily or weekly): what is the trend?
2. Find the levels: where has price repeatedly stopped, top and bottom?
3. Check volume: do recent moves have conviction behind them?
4. Locate today: is the current price mid-range (no-man's land), at support (decision zone), or breaking a level (an event)?
Beginner mistakes to avoid
Reading one timeframe only. A daily breakout means little if the weekly chart shows a wall of resistance just above.
Treating every pattern as a signal. Most patterns fail without a level and volume behind them.
Chasing a vertical move. By the time a chart looks exciting, the low-risk entry is usually gone; wait for a pullback to a level.
Ignoring volume. Price without volume is half the story — and the half that misleads most often.
For more structured learning, readers can also revisit the site's guide to reading a stock earnings report — charts tell you what the market did, earnings tell you what the business did, and the two together give a fuller picture. Discuss your chart reads in the Zimbuck Market News group and follow new learning guides on the Zimbuck News page. Join the conversation on Zimbuck to keep learning.
FAQ
What is a candlestick? One period's open, high, low and close in a single bar — body for open-to-close, wicks for the period's high and low.
What is support? A price zone where buying has repeatedly stopped declines; resistance is the mirror — where selling has repeatedly stopped advances.
Why does volume matter? It grades the price action: high-volume moves carry conviction, low-volume moves are easier to reverse.
Which timeframe should a beginner use? Daily charts for the trend, then shorter timeframes only for timing — never the reverse.
Can chart reading predict prices? No — it organizes probabilities and risk. Past price action is not a guarantee of future results.
This article is general educational information only, not financial advice.
References
Zimbuck News page: https://zimbuck.com/pages/zimbucknews
Zimbuck Market News group: https://zimbuck.com/groups/zimbuckmarketnews
Related: Bitcoin support and resistance: https://zimbuck.com/blogs/1038/Bitcoin-Support-and-Resistance-Explained-How-to-Read-Levels-Moving
Related: Bitcoin $76,000 levels: https://zimbuck.com/blogs/1009/Bitcoin-s-76-000-Line-in-the-Sand-The-Levels
Zimbuck home: https://zimbuck.com




