

Golden Cross and Death Cross Explained: How the 50-Day and 200-Day Moving Averages Signal Trend Shifts

Two of the most quoted phrases in trading sound like folklore: the golden cross and the death cross. They are not magic, and they are not predictions. They are simply what happens when two moving averages — one fast, one slow — change places on a chart. Once you understand that, you can read them without being fooled by them.
What a moving average actually is
A moving average smooths out price data by averaging closing prices over a set number of periods. A 50-day simple moving average, or SMA, adds up the last 50 daily closes and divides by 50. Each new day, the oldest price drops off and the newest one joins. A 200-day SMA does the same over roughly ten months of trading.
The shorter average reacts faster to recent price moves; the longer average moves slowly and shows the long-term trend. When the fast average sits above the slow one, recent prices have been stronger than the long-term trend. When it sits below, recent prices have been weaker. A crossover is the moment that relationship  flips.
The golden cross, step by step
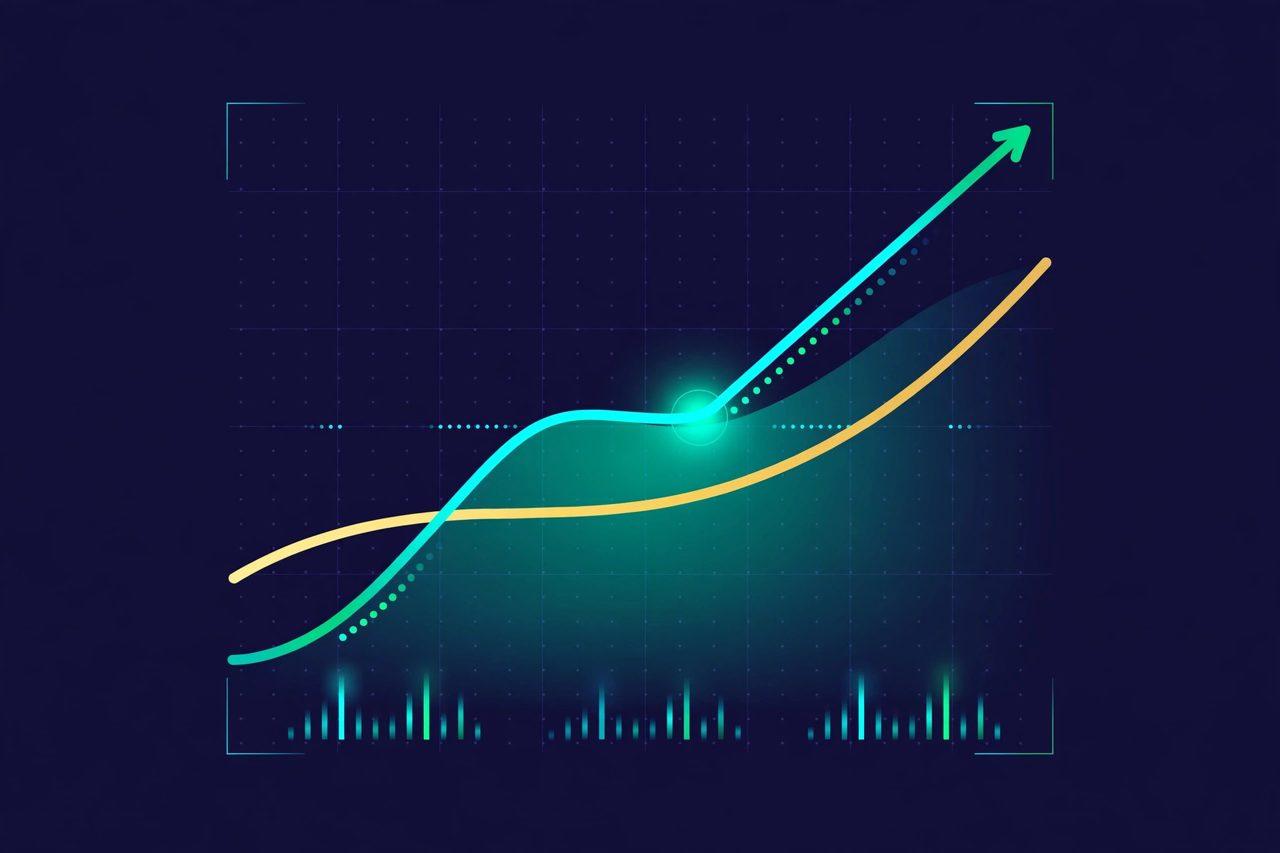
A golden cross occurs when a shorter-term moving average rises above a longer-term moving average. The most commonly referenced pair is the 50-day SMA crossing above the 200-day SMA. Traders often interpret it as a potentially bullish signal — a sign that medium-term momentum has overtaken the long-term trend.
It does not appear suddenly. It develops in three stages. First, a downtrend or sideways market leaves the 50-day below the 200-day. Second, price recovers, the 50-day turns up and crosses above the 200-day — that crossing day is the golden cross itself. Third, if the uptrend continues, the 50-day stays above the 200-day, confirming the new arrangement. Note the discipline in that third stage: a single crossing day is not a confirmed trend. The averages staying in their new order is what gives the signal weight.
The death cross, the mirror image
A death cross is the opposite: the shorter-term average falls below the longer-term average, most commonly the 50-day crossing below the 200-day. Traders often read it as a potentially bearish signal — recent weakness becoming pronounced enough to shift the market's dynamics.
It follows the same three-stage pattern in reverse. An uptrend leaves the 50-day above the 200-day; price weakens; the 50-day falls through the 200-day; and if weakness continues, the 50-day stays below. As with the golden cross, the condition persisting matters more than the single day it forms.
Why the 50-day and 200-day pair?
This combination balances responsiveness with stability. The 50-day captures roughly two months of trading activity — long enough to filter daily noise, short enough to react to a real trend change. The 200-day reflects about ten months, so it barely moves on any single week of news. Other traders use different pairs, such as a 20-day and 50-day for shorter-term trading, or exponential moving averages (EMAs), which give more weight to recent prices and therefore cross sooner. The principle is identical in every case: fast versus slow, and the moment they swap.
The one flaw you must never forget: lag
A crossover reflects what has already happened in price history. It does not predict what happens next. Because a 200-day average incorporates months of old prices, by the time a crossover confirms, a substantial part of the underlying move has often already happened. That is why experienced traders treat crossovers as confirmation, not as a trigger to buy or sell on their own.
Bitcoin in early November 2026 shows why this caution matters. In the first days of the month, Bitcoin traded below its 20-day and 50-day averages, with the 100-day average near $76,551 and the 200-day near $73,164 acting as the levels beneath price. A trader watching only for a golden cross would have waited in vain while price stayed under its averages — the averages were describing weakness that was already there, not forecasting a reversal. Crossovers work best alongside other evidence: volume, support and resistance levels, and whether price itself is confirming the averages' 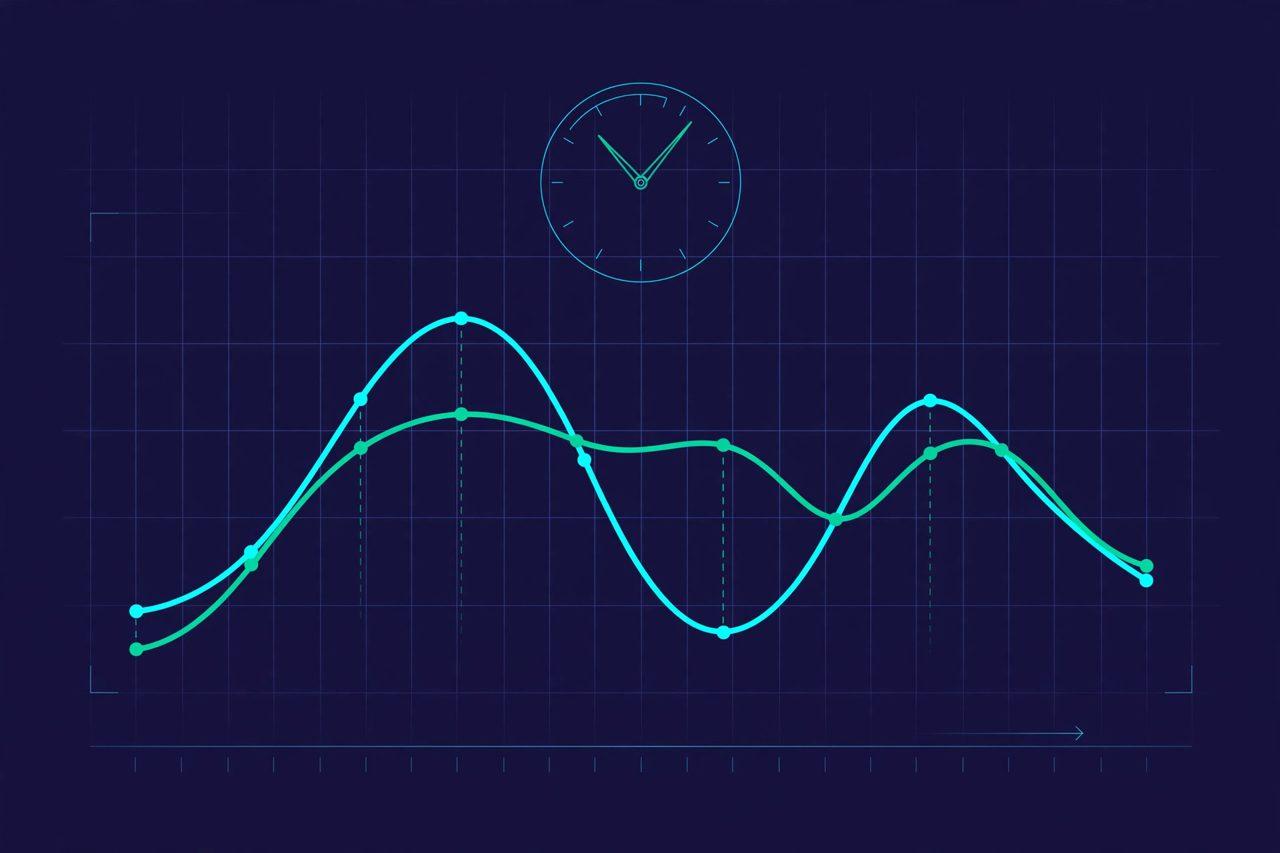 story.
How to use crossovers without being trapped by them
- Wait for the close. An intraday touch is not a crossover; the daily close is what counts for a daily-average signal.
- Demand confirmation. Is volume expanding on the move? Is price holding above the faster average after the cross? One-line signals fail in sideways markets, where averages crisscross repeatedly and generate false signals.
- Check the bigger picture. A golden cross during a strong downtrend in the wider market, or a death cross during a broad rally, deserves scepticism.
- Know your invalidation. If price falls back through the averages soon after a golden cross, the signal has failed — accept that quickly rather than defending it.
- Never trade a crossover alone. Pair it with support and resistance, trendlines, or momentum indicators such as RSI, and always size a position so that a false signal is a small loss, not a disaster.
FAQ
What is a golden cross?
When a shorter-term moving average, commonly the 50-day, crosses above a longer-term average, commonly the 200-day — widely read as a potential bullish trend shift.
What is a death cross?
The reverse: the 50-day crosses below the 200-day — widely read as a potential bearish trend shift.
Do golden crosses always lead to rallies?
No. They are lagging, backward-looking signals. They confirm a move already underway and can produce false signals, especially in choppy, sideways markets.
What is the difference between SMA and EMA?
A simple moving average weights every day equally; an exponential moving average gives more weight to recent prices, so it reacts faster — and can also whipsaw more.
Should beginners trade on crossovers?
Learn to recognise them first, paper-trade them, and never use them as your only signal. This guide is general education only, not financial advice. For more chart-reading basics, see the related guide on reading a Bitcoin chart https://zimbuck.com/blogs/649/How-to-Read-a-Bitcoin-Chart-Support-Resistance-Moving-Averages and the support and resistance explainer on Zimbuck https://zimbuck.com/blogs/1038/Bitcoin-Support-and-Resistance-Explained-How-to-Read-Levels-Moving , plus the Zimbuck News page https://zimbuck.com/pages/zimbucknews and the Zimbuck Market News group https://zimbuck.com/groups/zimbuckmarketnews . An authoritative explainer of both crosses is available at https://www.cmcmarkets.com/en-gb/technical-analysis/golden-cross-and-death-cross-explained . Join the conversation on Zimbuck https://zimbuck.com and share which crossover, if any, you actually watch on your own charts.




