

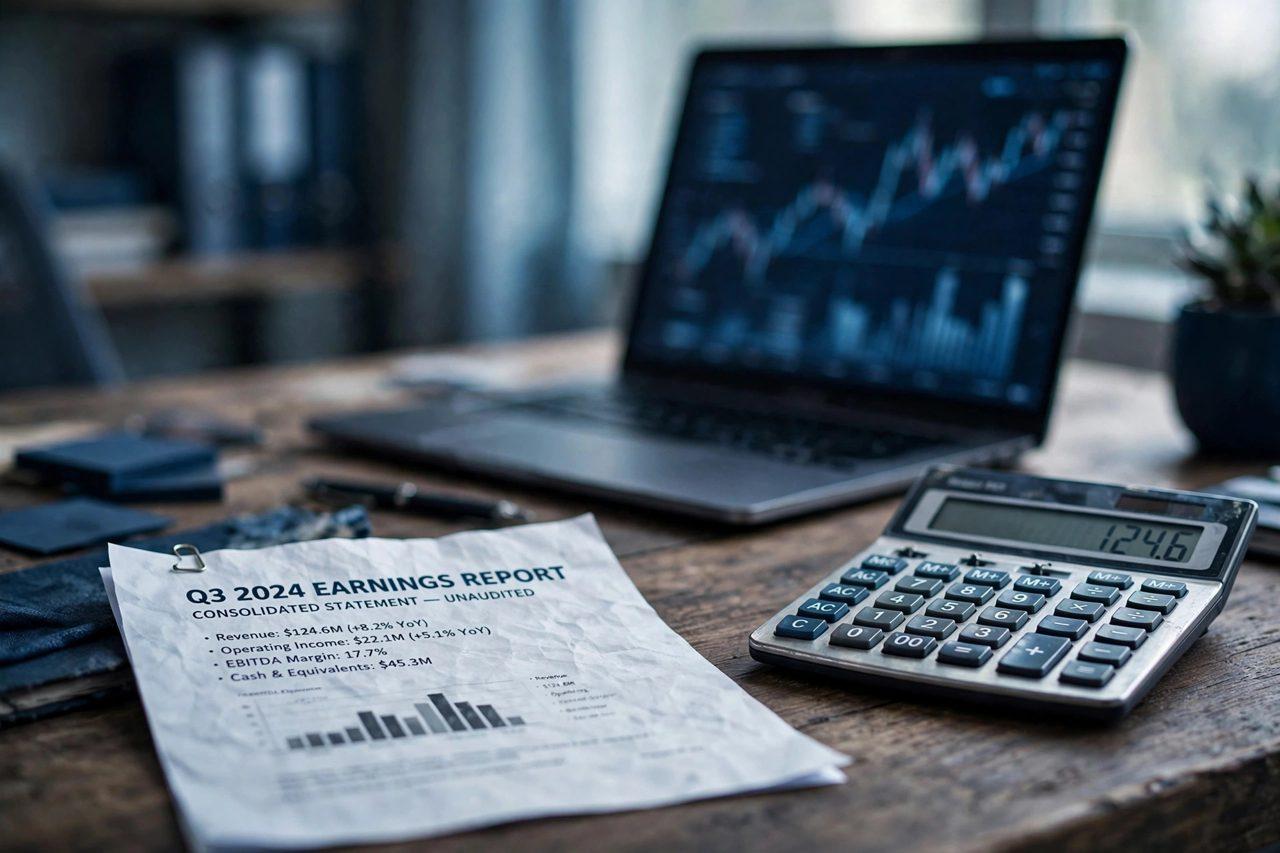
How to Read a Stock Earnings Report: Revenue, EPS, Margins and Guidance Explained

Every quarter, listed companies open their books in an earnings report — and the stock can jump or slide within minutes of the numbers landing, even when the business itself barely changed.
That reaction makes more sense once you know which lines traders read first, and why a company can beat expectations and still fall. This guide walks through the report in the order the market does.
Start with revenue and EPS
Revenue is the total money the company took in during the quarter — the top line, before costs. Earnings per share (EPS) is the profit divided by the number of shares — the bottom line that headlines usually quote. For both figures, the comparison that moves prices is not last year alone; it is the result versus what analysts expected. A company can grow profit and still disappoint if the market expected more. Recent examples on Zimbuck include our coverage of BJ's Wholesale Club's quarter, where a strong EPS beat met a much more cautious share reaction.

Then read the margins
Margins show how much of each revenue dollar survives as profit. Gross margin reflects pricing power after direct production costs. Operating margin also subtracts the cost of running the business. Expanding margins usually mean efficiency or pricing strength; shrinking margins can flag rising costs or discounting. One quarter is noise — the trend across several quarters is the story, and it is a theme that runs through the earnings coverage collected on the Zimbuck News page.
Guidance is often the real headline
Guidance is management's own forecast for the coming quarter or year. Stocks frequently move more on guidance than on the results just reported, because prices already reflect the past. Raised guidance tells the market the future looks better than expected; cut or withdrawn guidance does the opposite — sometimes violently. When you see a stock move strangely after solid results, guidance is the first place to look. Members walk through these reports together in the Zimbuck Market News group.
Cash flow and the balance sheet
Profit is an accounting figure; cash is harder to argue with. Operating cash flow shows whether the business actually generated cash, and free cash flow is what remains after investment in the business itself. Finally, glance at debt: a company entering a downturn with heavy borrowing has less room for mistakes than one holding net cash.
A simple five-minute checklist
- Revenue versus expectations and versus last year
- EPS versus expectations
- Margin direction versus previous quarters
- Guidance — raised, held or cut
- Cash flow and debt trend

Frequently asked questions
What is an earnings beat or miss? A beat means results came in above analyst expectations; a miss means below. Prices react to the gap, not just the result.
Why do stocks fall after good earnings? Usually because expectations were even higher, guidance disappointed, or traders sell after a run-up into the report.
When are earnings released? Most companies report before the market opens or after it closes, so the full reaction shows at the next session.
What is an earnings call? A live call where management discusses results and answers analyst questions; tone and caution in answers can move the stock too.
Read in this order, an earnings report stops being a wall of numbers and becomes a short story: what the company sold, what it kept, and what it expects next. Follow quarterly coverage and join the community on Zimbuck.
This article is market news and general information only, not financial advice.




